Introduction to inference about slope in linear regression | AP Statistics | Khan Academy
TLDRThe video script discusses the concept of regression lines and statistical inference, emphasizing the relationship between shoe size and height. It explains how to use sample data to estimate population parameters and create a regression line, highlighting the variability in results due to different samples. The script also introduces the idea of confidence intervals and hypothesis testing to make inferences about the true population slope and to determine if there is a significant linear relationship.
Takeaways
- 📈 The concept of regression lines and statistical inference are being discussed, with an emphasis on making inferences from a regression line.
- 👟 The example used is the positive association between shoe size and height, suggesting that as shoe size increases, so does height.
- 📊 A scatter plot is mentioned where the horizontal axis represents shoe size and the vertical axis represents height, with data points representing a sample of individuals.
- 🔢 The process of fitting a regression line to data points is explained, with the goal of minimizing the squared distance between the points and the line.
- 🎯 The equation of a regression line is introduced as y hat = a + b * x, where 'a' is the y-intercept and 'b' is the slope.
- 🔄 It's emphasized that different samples will yield different results for 'a' and 'b', highlighting the variability in sample-based statistics.
- 🌍 The idea of a true population regression line is introduced, represented by y hat = α + β * x, where α and β are the true population parameters.
- 🔍 The challenge of estimating true population parameters is discussed, with the use of sample statistics as a solution.
- 📝 The construction of confidence intervals for the sample regression line slope is mentioned as a method for making inferences about the true population slope.
- 💡 The concept of hypothesis testing is linked to regression analysis, with the null hypothesis stating no nonzero linear relationship and the alternative hypothesis suggesting a positive or nonzero relationship.
- 📊 The process of using sample statistics to test hypotheses and make inferences about population parameters is summarized, drawing parallels to previous concepts learned about proportions and means.
Q & A
What is the main topic of discussion in the video?
-The main topic of discussion in the video is regression lines and how to make inferences from them, including understanding statistical inference and hypothesis testing in the context of a positive association between shoe size and height.
What is the significance of understanding the idea of regression before watching this video?
-Understanding the idea of regression is significant because it forms the foundation for grasping the concepts of making inferences from a regression line, which is the core focus of the video.
How does the video illustrate the association between shoe size and height?
-The video illustrates the association by using a hypothetical example where shoe size is placed on the horizontal axis and height on the vertical axis, and then it discusses taking a random sample of people to plot data points and fit a regression line through these points.
What is the typical technique used to fit a regression line to data points?
-The typical technique used to fit a regression line is to minimize the squared distance between the data points and the line, which is often done using computers.
What does the equation of a regression line represent?
-The equation of a regression line represents the estimated relationship between the variables, typically shown as y-hat (predicted value) equals the y-intercept (a) plus the slope (b) times the x variable.
Why might different samples yield different results for the regression line?
-Different samples might yield different results for the regression line because each sample provides different data points, which can affect the fit of the line and thus the estimated y-intercept and slope.
What are the true population parameters in the context of regression lines?
-The true population parameters are the actual y-intercept (alpha) and slope (beta) of the regression line for the entire population, which would be determined if theoretically every individual in the population could be measured.
How can we estimate the true population parameters?
-We estimate the true population parameters using sample statistics, specifically the sample's y-intercept (a-sub-one, a-sub-two, etc.) and slope (b-sub-one, b-sub-two, etc.) from the regression lines fitted to different samples.
What is the purpose of creating a confidence interval for the slope of a regression line?
-The purpose of creating a confidence interval for the slope is to estimate the range within which the true population slope is likely to fall, providing a measure of uncertainty around the sample-based estimate.
How does hypothesis testing relate to regression line analysis?
-Hypothesis testing in regression line analysis involves setting up a null hypothesis that there is no nonzero linear relationship (the population slope is zero) and an alternative hypothesis that there is a positive or nonzero relationship. The test then calculates the probability of observing a statistic as extreme as the sample slope, or more extreme, to decide whether to reject the null hypothesis in favor of the alternative.
What statistical tools are used to make inferences about the population regression line?
-Statistical tools used to make inferences about the population regression line include the standard error of the sample statistic, critical t-values, and concepts of confidence intervals and hypothesis testing based on sample data.
Outlines
📊 Introduction to Regression Lines and Statistical Inference
This paragraph introduces the concept of regression lines within the context of statistical inference. The instructor emphasizes that regression lines have been previously discussed and encourages viewers unfamiliar with the concept to watch introductory videos. The main focus here is on making inferences from a regression line, which is a new topic for the audience. The instructor uses the example of a positive association between shoe size and height to illustrate the concept. A hypothetical scenario is presented where a random sample of 20 people is taken, and their shoe sizes and heights are plotted as data points. The goal is to fit a regression line to these data points using a computer, minimizing the squared distance between the points and the line. The equation of the regression line is introduced, with the understanding that different samples will yield different results, highlighting the need for statistical estimation of population parameters.
📈 Confidence Intervals and Hypothesis Testing for Regression Lines
The second paragraph delves into the specifics of creating confidence intervals and conducting hypothesis testing for the slope of a regression line. The instructor explains the process of estimating the standard deviation of the sampling distribution of the sample statistic, which in this case is the slope of the regression line, using the standard error. A critical t-value is introduced as a tool for determining the confidence interval at a given confidence level, based on the degrees of freedom derived from the sample size. The paragraph also discusses setting up a null hypothesis for no nonzero linear relationship and an alternative hypothesis for a positive or nonzero relationship. The concept of rejecting the null hypothesis in favor of the alternative if the probability of obtaining a more extreme statistic is below a certain threshold is also explained, reinforcing the idea of using sample statistics to make inferences about population parameters for a theoretical population regression line.
Mindmap
Keywords
💡Regression Lines
💡Statistical Inference
💡Hypothesis Testing
💡Sample
💡Population Parameters
💡Sample Statistics
💡Confidence Interval
💡Standard Error
💡Critical Value
💡Degrees of Freedom
💡Linear Relationship
Highlights
The video discusses the concept of regression lines and how to make inferences from them.
Regression lines are used to examine the association between two variables, such as shoe size and height.
A random sample of data is used to create a regression line, which can then be used for statistical inference.
The process of fitting a regression line to data involves minimizing the squared distance between data points and the line.
The equation of a regression line is represented as y hat = a + bx, where a is the y-intercept and b is the slope.
Different samples will yield different results for the regression line parameters (a and b).
The true population parameters (alpha and beta) are unattainable but can be estimated through sample statistics.
Confidence intervals can be constructed around the sample statistic to estimate the true population parameter.
Hypothesis testing can be performed to determine if there is a nonzero linear relationship between variables.
The null hypothesis for regression lines is that there is no nonzero linear relationship between the variables.
The alternative hypothesis allows for a positive or nonzero linear relationship.
Critical t-values and degrees of freedom are used to determine confidence intervals and perform hypothesis testing.
The process of estimating population parameters from a sample is a core aspect of regression analysis.
Regression analysis is a powerful tool for making predictions and understanding relationships between variables.
The video provides an introduction to the statistical techniques used in regression analysis, such as minimizing squared distances and constructing confidence intervals.
Understanding the theoretical basis of regression lines is crucial for appropriate application and interpretation of results.
The video emphasizes the importance of using sample data to make inferences about the population.
Transcripts
Browse More Related Video

Sampling Distributions: Introduction to the Concept

math 119 Chapter 9 part 2
Confidence Interval [Simply explained]
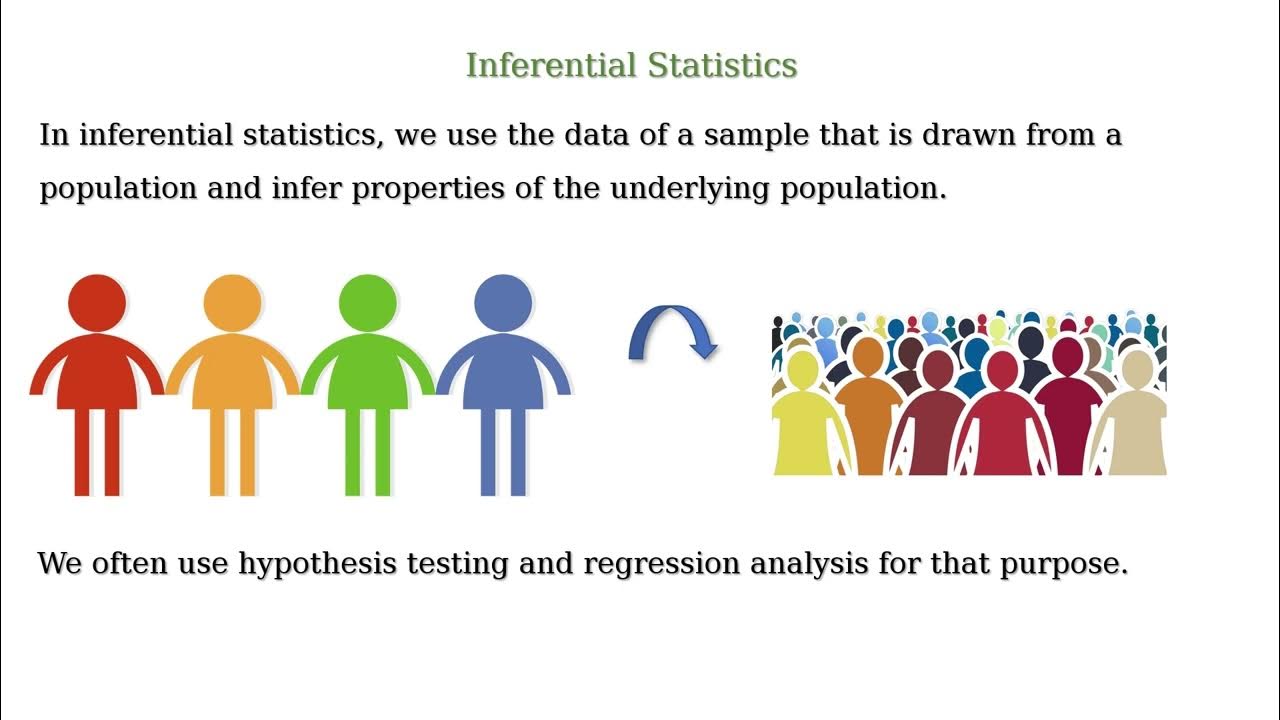
Descriptive Statistics vs. Inferential Statistics
Statistics Course Overview | Best Statistics Course | MarinStatsLectures
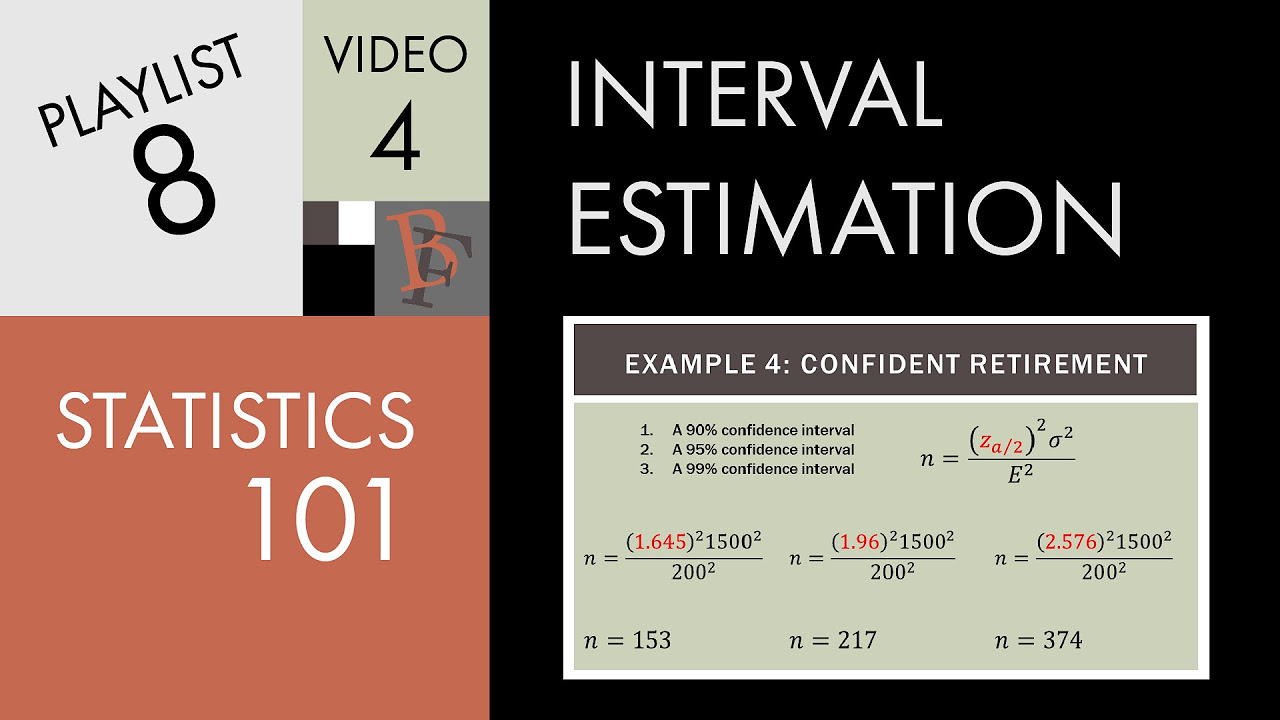
Statistics 101: Confidence Intervals, Estimating Sample Size Needed
5.0 / 5 (0 votes)
Thanks for rating: