Calculate the P-Value in Statistics - Formula to Find the P-Value in Hypothesis Testing
TLDRThis transcript delves into the concept of p-values in the context of hypothesis testing, particularly for large sample sizes. It explains that p-values, representing the probability of obtaining a sample more extreme than the observed data if the null hypothesis is true, serve as a tool to guide the decision to reject or fail to reject a null hypothesis. The lesson clarifies that p-values align with the direction of the tail in a distribution, whether left or right, and emphasizes their practicality in real-world research. The process of calculating and interpreting p-values is detailed, highlighting their significance in statistical analysis.
Takeaways
- 📊 Understanding p-values is crucial in hypothesis testing, particularly for large sample sizes and real research applications.
- 🎯 The p-value represents the probability of obtaining a sample more extreme than the observed data, given that the null hypothesis is true.
- 🔍 In left-tailed tests, 'more extreme' refers to values further to the left of the distribution curve, whereas in right-tailed tests, it refers to values further to the right.
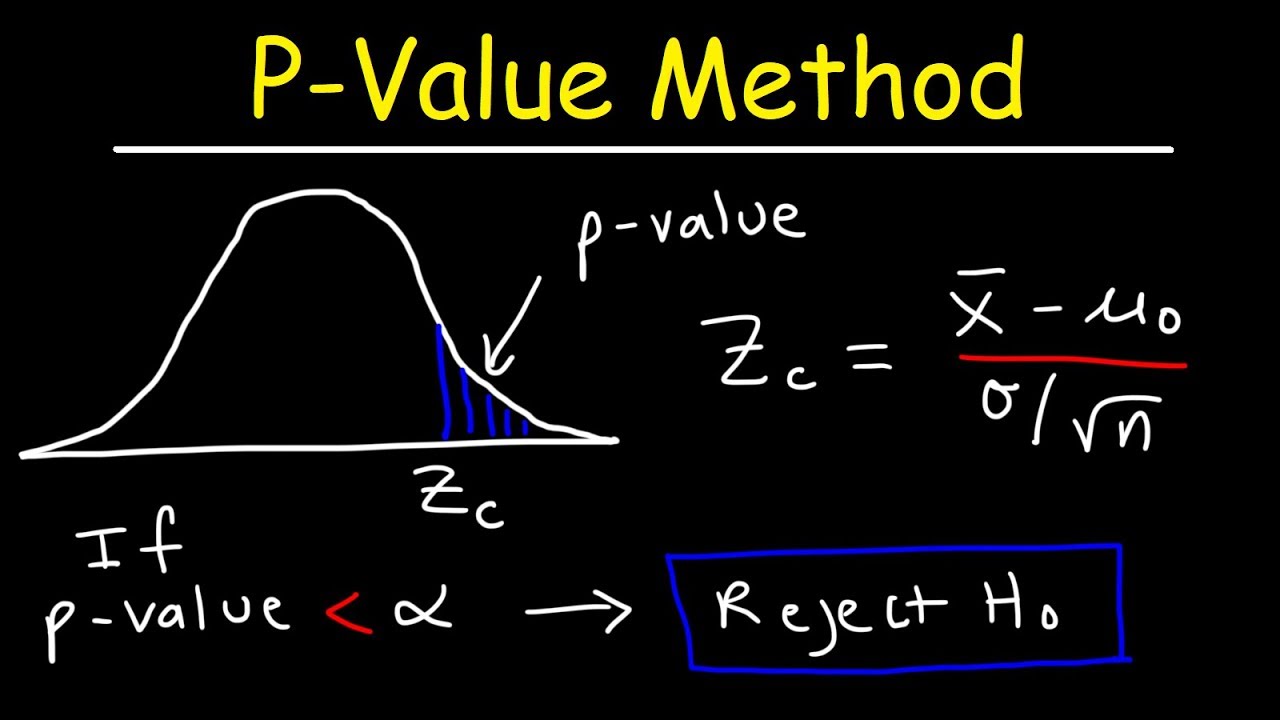
- 📈 The p-value is calculated based on the test statistic (Z-score) derived from the sample data and is used to make decisions regarding the null hypothesis.
- 🔢 The concept of 'more extreme' is context-dependent and tied to the direction of the tail in the specific hypothesis test being conducted.
- 📚 To find the p-value for a left-tailed test, you look up the area to the left of the Z-score in a standard normal distribution table.
- 🔄 For a right-tailed test, you flip the sign of the Z-score when looking up the area in the standard normal distribution table to find the p-value.
- 🌟 P-values serve as triggers to decide when to reject or fail to reject the null hypothesis, similar to the role of rejection regions.
- 📝 The p-value is an area under the curve, either to the left or right of the test statistic, and is not just a single numerical value.
- 🚦 In practice, p-values are more commonly reported in research papers and statistical analysis than rejection regions.
- 📋 The process of calculating and using p-values is iterative and builds upon the foundational concepts of hypothesis testing and probability.
Q & A
What is the primary purpose of a p-value in hypothesis testing?
-The primary purpose of a p-value in hypothesis testing is to help determine whether to reject or fail to reject the null hypothesis. It represents the probability of obtaining a sample more extreme than the one observed, given that the null hypothesis is true.
How does the concept of a p-value differ from using rejection regions in hypothesis testing?
-While rejection regions provide rigid boundaries to decide the acceptance or rejection of a null hypothesis, p-values offer a more nuanced approach by quantifying the probability of observing data as extreme as, or more extreme than, the sample data if the null hypothesis is true. P-values are more commonly used in real research.
What is the definition of a p-value as presented in the transcript?
-A p-value is defined as the probability of obtaining a sample more extreme than the ones observed in the data, assuming that the null hypothesis is true.
How does the direction of a tail influence the interpretation of 'more extreme' in hypothesis testing?
-The direction of a tail determines the direction in which 'more extreme' values lie. In a left-tailed test, 'more extreme' refers to values less than the observed data, while in a right-tailed test, 'more extreme' refers to values greater than the observed data.
What is the relationship between the test statistic and the p-value in hypothesis testing?
-The test statistic, derived from the sample data, represents a single value that encapsulates the entire data set. The p-value is the probability of obtaining a test statistic more extreme than the one calculated from the sample data, depending on whether it's a left-tailed or right-tailed test.
How can you find the p-value for a left-tailed hypothesis test?
-For a left-tailed test, you calculate the test statistic (Z-value) from your sample data and use a standard normal distribution table to find the area to the left of that Z-value. This area is the p-value.
How can you find the p-value for a right-tailed hypothesis test?
-For a right-tailed test, you calculate the test statistic (Z-value) and then look up the area to the right of that Z-value in a standard normal distribution table. This area represents the p-value.
What is the significance of the p-value in the context of the null hypothesis?
-The p-value is significant because it provides a quantifiable measure that helps in making a decision about the null hypothesis. If the p-value is less than the chosen level of significance (alpha), the null hypothesis is rejected; otherwise, it is not rejected.
How does the concept of 'more extreme' tie into the idea of hypothesis testing?
-The concept of 'more extreme' is tied to the alternative hypothesis and the direction of the test. It helps define the conditions under which the null hypothesis would be rejected or not. 'More extreme' values are those that are less likely to occur if the null hypothesis were true, thus providing evidence against it.
What is the role of the normal distribution table in calculating p-values?
-The normal distribution table provides the areas under the curve to the left of specific Z-values. This information is used to calculate p-values by identifying the area that represents the probability of obtaining a sample more extreme than the observed data, based on the test statistic and the direction of the test.
Why is it important to understand both rejection regions and p-values in hypothesis testing?
-Understanding both rejection regions and p-values provides a comprehensive approach to hypothesis testing. While rejection regions offer a straightforward method, p-values offer a more detailed understanding of the evidence against the null hypothesis, allowing for more nuanced statistical decisions in research.
Outlines
📊 Introduction to P-Values in Hypothesis Testing
This paragraph introduces the concept of p-values within the context of hypothesis testing for large sample means. The speaker explains that p-values, like rejection regions previously discussed, serve as a tool to determine whether to reject or fail to reject the null hypothesis. The p-value is defined as the probability of obtaining a sample more extreme than the observed data, given that the null hypothesis is true. The speaker emphasizes the importance of understanding p-values not just through definition, but also through practical examples and their application in real research scenarios.
🔍 Interpreting P-Values and Their Role in Statistical Analysis
The speaker delves deeper into the interpretation of p-values, explaining that they represent the likelihood of obtaining a data set more extreme than the one collected. The concept of 'more extreme' is clarified as being dependent on the direction of the tail in the hypothesis test, whether left or right. The paragraph also introduces the idea of using a normal distribution curve to visualize the p-value as an area under the curve, which is key to understanding its role in hypothesis testing. The speaker aims to demystify p-values and provide an intuitive understanding of their significance in statistical analysis.
📈 Calculating P-Values for Left-Tailed Tests
This paragraph focuses on the process of calculating p-values for left-tailed tests. The speaker provides a step-by-step explanation of how to use the Z-score obtained from sample data to find the corresponding p-value. By referencing the normal distribution table, the speaker demonstrates how to look up the area to the left of the Z-score to find the p-value, which represents the probability of obtaining a more extreme data set to the left of the observed values. The explanation is grounded in a practical example, where the null hypothesis and alternate hypothesis are clearly defined, and the Z-score is given, allowing for a clear illustration of the process.
📊 Determining P-Values for Right-Tailed Tests
The speaker continues the discussion on p-values, this time focusing on right-tailed tests. A hypothetical scenario is presented where the null and alternate hypotheses are defined, and a Z-score is provided. The speaker explains that the p-value for a right-tailed test is calculated by finding the probability of obtaining a more extreme data set to the right of the observed values. This involves using the normal distribution table to find the area to the right of the Z-score. However, since the table provides areas to the left, the speaker clarifies that the sign of the Z-score must be flipped to find the correct area. The process is demonstrated with a clear example, reinforcing the concept of p-values in the context of right-tailed hypothesis testing.
🎯 Utilizing P-Values for Decision Making in Hypothesis Testing
In the final paragraph, the speaker emphasizes the ultimate goal of understanding p-values: to use them for decision making in hypothesis testing. The speaker reiterates that p-values, whether for left-tailed, right-tailed, or two-tailed tests, provide the necessary information to decide whether to reject or fail to reject the null hypothesis. The concept is linked back to the earlier discussion on rejection regions, highlighting that p-values serve a similar purpose but are more commonly used in real-world research. The speaker assures the audience that a deeper understanding of using p-values for decision making will be achieved in the subsequent sections, encouraging a step-by-step approach to grasping this crucial aspect of statistical analysis.
Mindmap
Keywords
💡Hypothesis Testing
💡P-Value
💡Rejection Region
💡Test Statistic
💡Sample Size
💡Level of Significance (Alpha)
💡Null Hypothesis
💡Alternative Hypothesis
💡Z-Score
💡Normal Distribution
💡Type I Error
Highlights
Introduction to the concept of p-value in the context of large sample hypothesis testing of means.
Explanation that p-values are used to determine whether to reject or fail to reject the null hypothesis, similar to rejection regions.
Discussion on the common usage of p-values in real research as opposed to rejection regions.
Definition of p-value as the probability of obtaining a sample more extreme than the observed data, assuming the null hypothesis is true.
Clarification that p-values are a decimal between 0 and 1, representing the likelihood of getting more extreme data.
Illustration of how p-values are calculated for left-tailed tests by finding the area to the left of the test statistic on a distribution curve.
Explanation of how p-values are calculated for right-tailed tests by finding the area to the right of the test statistic on a distribution curve.
Use of the normal distribution table to find p-values by looking up the area to the left of a given Z-score.
Procedure for finding p-values in right-tailed tests by flipping the sign of the Z-score when using the normal distribution table.
The p-value representing the probability of obtaining a more extreme sample in future studies than the current sample data.
Emphasis on the importance of understanding p-values as an area under the curve, either to the left or right depending on the tail of the test.
Introduction to the use of p-values in making decisions about hypothesis testing, akin to using rejection regions.
Explanation that p-values will be used to decide if we reject or fail to reject the null hypothesis, providing a statistical decision-making tool.
Illustration of the concept of 'more extreme' in the context of hypothesis testing, which depends on the direction of the test (left or right tail).
Demonstration of how the p-value changes based on the tail of the test (left or right) and its impact on the interpretation of the results.
Reinforcement of the idea that p-values are a crucial part of hypothesis testing and statistical analysis.
Guidance on how to visually represent p-values on a distribution curve and how they relate to the test statistic.
Transcripts
Browse More Related Video

05 - Using P-Values in Hypothesis Testing (Compare P Value to Level of Significance)

P-Value Problems: Crash Course Statistics #22

What is p-value? How we decide on our confidence level.

p-values: What they are and how to interpret them
P-Value Method For Hypothesis Testing
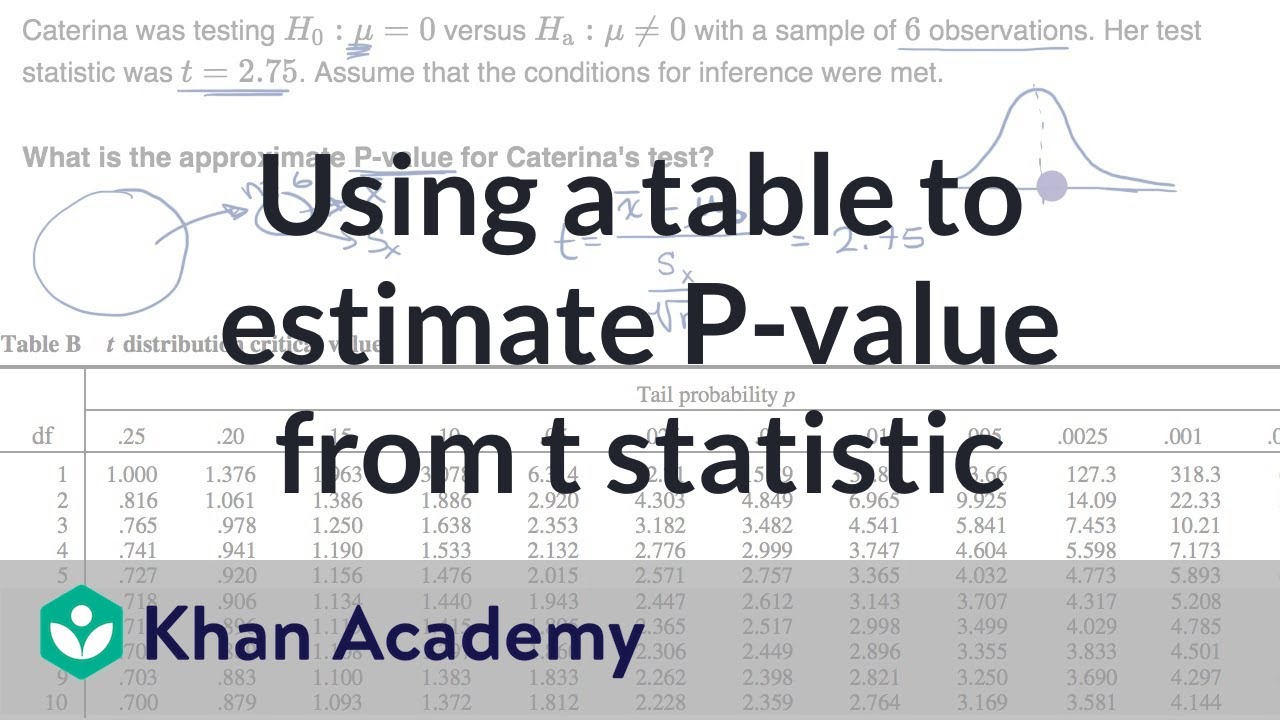
Using a table to estimate P-value from t statistic | AP Statistics | Khan Academy
5.0 / 5 (0 votes)
Thanks for rating: