Plotting Points in TI 84
TLDRThis tutorial offers a step-by-step guide on plotting data points using a TI-83 or 84 calculator. It begins with navigating to the 'stat' menu and editing lists, where X values are entered into list 1 and Y values into list 2. The video then explains how to set up a scatter plot by activating it and ensuring the X and Y lists are correctly referenced as 'l1' and 'l2'. It emphasizes the importance of clearing any existing content from the 'y=' equation area to avoid interference with the graph. The tutorial concludes with instructions on using the 'zoomstat' function to display the graph correctly, highlighting the necessity of this final step for accurate data visualization.
Takeaways
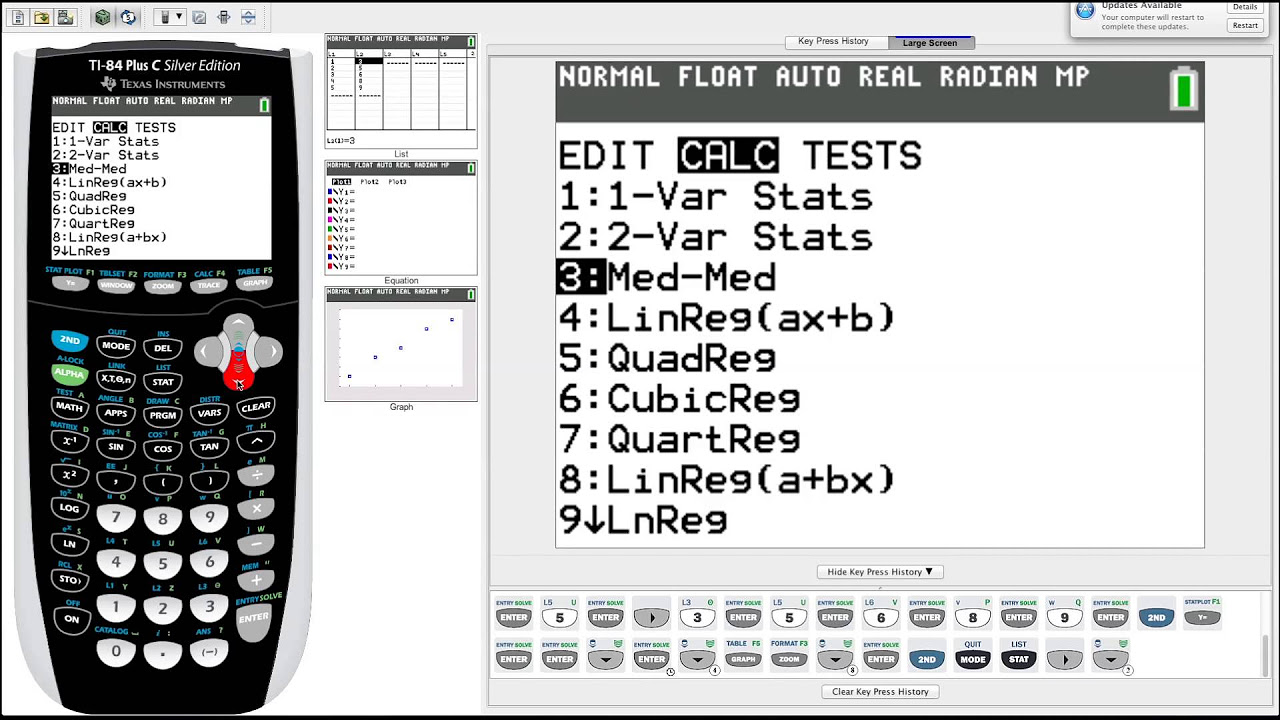
- 💻 Starting with 'STAT' is the first step in plotting data points on the TI-83 or 84 calculator.
- 🔍 Access data editing options by selecting 'Edit' under the 'STAT' menu to input X and Y values.
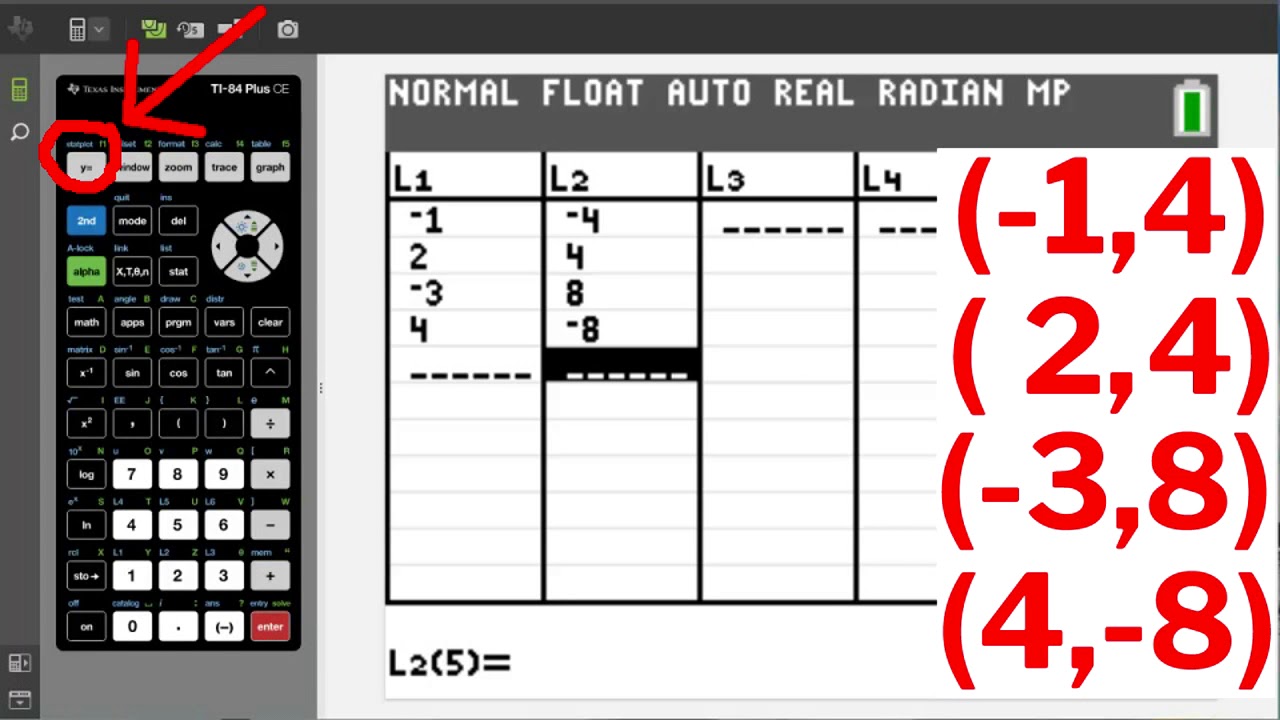
- 📈 X values should be entered in list 1 (L1) and Y values in list 2 (L2) for plotting.
- ❌ Clear existing values in a list by selecting the list, pressing 'Clear', then 'Enter', if the list is not empty.
- 👇 Pair X and Y values in lists L1 and L2 respectively, e.g., 1-2, 2-4, 3-8, 4-16.
- 🔮 Use 'STAT PLOT' above the 'Y=' key to access plot settings using the second function key.
- 📺 Enable a stat plot by turning it 'On' and ensure the type is set to scatter plot for X and Y data points.
- ✏️ Verify X and Y lists are correctly assigned to L1 and L2 in the stat plot settings.
- 🚨 Ensure the 'Y=' equation area is clear to avoid interference with the plot.
- 🔎 Use 'ZoomStat' (option 9 under 'Zoom') to correctly display the plotted points on the graph.
- 👀 'Trace' key next to 'Graph' allows viewing of individual data points with their X and Y values.
Q & A
How do you start entering data points into the TI-83 or TI-84 calculator?
-To begin entering data points into the TI-83 or TI-84 calculator, you need to open the calculator, access the 'STAT' menu by pressing the 'STAT' button, and then select the first option, 'Edit', to start inputting your data points.
Where do you input X and Y values in the calculator?
-X values are to be entered in list 1 (L1) and Y values in list 2 (L2) after accessing the 'Edit' option under the 'STAT' menu.
What should you do if there are already values in a list when you're trying to enter new data points?
-If there are existing values in a list, navigate to the top of the list until it's highlighted, then press 'CLEAR' followed by 'ENTER' to remove all values from that column before inputting new data.
How can you access the 'STAT PLOT' feature on the TI-83 or TI-84?
-To access the 'STAT PLOT' feature, press the 'second function' key followed by 'Y=' (which has 'STAT PLOT' written above it) to set up your data plot.
How do you enable a plot for graphing on the calculator?
-To enable a plot for graphing, after accessing the 'STAT PLOT' menu, select one of the plots (if it's turned off), press 'ENTER' to turn it on, and ensure it's set to the 'on' position.
What type of graph is recommended for plotting simple X and Y data points in this tutorial?
-The tutorial recommends using a scatter plot for graphing simple X and Y data points.
Why is it important to ensure there are no equations in the 'Y=' equation area before graphing?
-It's important to ensure the 'Y=' equation area is clear of any equations before graphing to prevent any existing equations from interfering with the data plot you're trying to graph.
What is the purpose of the 'ZoomStat' function in graphing data points?
-'ZoomStat' automatically adjusts the graph's view to optimally display all the entered data points, making it a crucial step for correctly viewing the graphed data.
How can you view the individual data points along with their X and Y values on the graph?
-After graphing the data points, you can press the 'TRACE' key next to the 'GRAPH' key to navigate through the individual data points and see their X and Y values displayed at the bottom of the screen.
What common mistake should be avoided when trying to graph data points?
-A common mistake to avoid is directly pressing the 'GRAPH' button without first using the 'ZoomStat' function, as this may not display the data points correctly.
Outlines
📊 Plotting Data Points on TI-83/84 Calculators
This tutorial walks through the process of plotting data points on TI-83 or TI-84 calculators, starting from opening the calculator and accessing the 'STAT' menu. The video demonstrates how to enter X and Y values into lists (List 1 and List 2 respectively), ensuring any existing values are cleared before inputting new data. The focus is on setting up a scatter plot by activating and configuring a 'Stat Plot,' selecting the correct graph type, and ensuring the X and Y lists correspond to the inputted data. The tutorial emphasizes the importance of having a clear 'Y=' equation area to avoid interference with the plot and concludes with instructions on using the 'ZoomStat' feature to view the plotted points accurately. The 'Trace' function is highlighted as a tool for viewing individual data points' coordinates.
Mindmap
Keywords
💡TI-83/84
💡Stat Plot
💡Data Points
💡List 1 and List 2
💡Scatter Plot
💡Edit
💡ZoomStat
💡Y=
💡Trace
💡Calculator Menu Navigation
💡Graphing
Highlights
The tutorial begins with opening the calculator and navigating to the 'stat' menu.
The first step is to go to 'stat' and select 'edit' to input data points.
X values are entered into list 1, and Y values into list 2.
To clear existing values from a list, highlight the list and press 'clear' followed by 'enter'.
The example given has X values of 1, 2, 3, and 4, and Y values of 2, 4, 8, and 16.
After entering data points, proceed to set up the stat plot.
Access the stat plot by pressing the second function key below 'y='.
Only one plot is needed for this tutorial, which is a scatter plot.
Ensure that the X list is set to L1 and the Y list to L2 for correct plotting.
Before graphing, clear the equation area to avoid interference with the plot.
To display the graph, use the 'zoomstat' command by pressing the 'zoom' key and selecting number 9.
The 'trace' key can be used to view individual points with their XY coordinates.
It is important to follow the correct steps to ensure the graph is displayed accurately.
The tutorial aims to help students understand how to plot data points correctly on a TI-83 or 84 calculator.
This method can be applied to various types of data for statistical analysis.
The tutorial provides a clear, step-by-step guide for using the calculator's graphing functions.
Transcripts


5.0 / 5 (0 votes)
Thanks for rating: