What does area have to do with slope? | Chapter 9, Essence of calculus
TLDRThe video script explores the concept of finding the average value of a continuous function, using the sine function as an example. It explains how integrals and derivatives are inverse operations, with integrals approximating the average value over an interval by dividing the area under the curve by its width. The process involves sampling points, using the concept of an antiderivative to find the average slope, and relating this to the change in the antiderivative's value over the interval. The example concludes with the average value of sin(x) from 0 to π being 2/π, highlighting the practical applications of this mathematical approach in understanding phenomena like the effectiveness of solar panels across seasons.
Takeaways
- 📊 Understanding the concept of the average of a continuous variable is crucial for grasping the inverse relationship between integrals and derivatives.
- 🌐 The average height of a graph, such as sinx from 0 to π, can be related to real-world phenomena like the effectiveness of solar panels across seasons.
- ∞ The challenge of finding an average lies in the infinite number of values present over a continuous interval, which cannot be summed directly.
- 🔍 To approximate the average, one can sample finite points evenly spaced along the interval and calculate the average of these points' heights.
- 📈 The process of finding the average involves dividing the sum of the sampled points' heights by the number of points, which intuitively relates to the integral of a function.
- 🧠 The integral of a function over an interval can be thought of as the limit of the sum of the function's values times an infinitesimal dx, as dx approaches 0.
- 📚 The antiderivative of a function is key to evaluating integrals, as it provides the area under the curve, which is related to the average value over the interval.
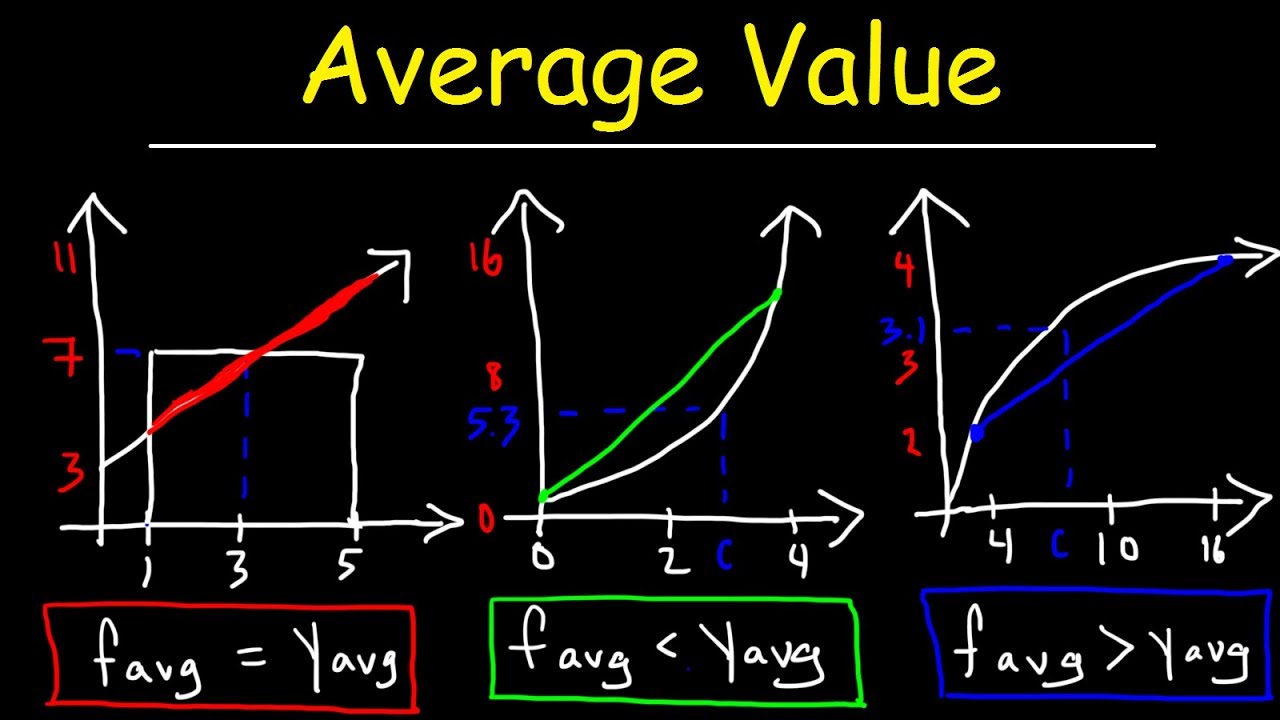
- 📶 The average value of a function on an interval is found by taking the integral of the function and dividing by the interval's width, representing the area under the graph divided by its width.
- 🏞️ The average height of the sine graph from 0 to π is found to be 2/π, demonstrating the connection between the area under the curve and the slope of the antiderivative graph.
- 🔄 The antiderivative graph's slope between two endpoints represents the average value of the original function over that interval, as the derivative of the antiderivative gives the original function's slope at each point.
- 💡 Recognizing when a problem can be approximated by adding up many small components or when generalizing a finite concept to a continuous range can indicate the application of integrals.
Q & A
What is the main topic discussed in the transcript?
-The main topic discussed in the transcript is the concept of finding the average of a continuous variable using integration, and how this relates to the inverse relationship between integrals and derivatives.
Why is finding the average of a continuous variable significant?
-Finding the average of a continuous variable is significant because it provides a different perspective on why integrals and derivatives are inverse operations, and it has practical applications in understanding phenomena modeled by continuous functions, such as the average effectiveness of solar panels across different seasons.
How does the concept of integration help in approximating the average of a continuous variable?
-Integration helps in approximating the average of a continuous variable by breaking down the problem into finite sums of the function values at evenly spaced points (sampling) and then taking the limit as the number of samples increases, which converges to the integral of the function over the interval.
What is the relationship between the average height of a graph and its integral?
-The average height of a graph is related to its integral by the fact that the integral represents the signed area under the curve, and dividing this area by the width of the interval gives the average height, which can be intuitively understood as the average slope of the tangent lines to the graph.
How is the average value of the sine function over half of its period calculated?
-The average value of the sine function over half of its period is calculated by evaluating the integral of sin(x) from 0 to π, and then dividing the result by the width of the interval (π). For the sine function, this results in an average value of 2/π or approximately 0.64.
What is the antiderivative of the sine function?
-The antiderivative of the sine function is the negative cosine function, -cos(x).
How does the change in the antiderivative over an interval relate to the average value of the function?
-The change in the antiderivative over an interval (the difference in the antiderivative's value at the upper and lower bounds of the interval) divided by the width of the interval gives the average value of the function over that interval.
What is the significance of the area under a graph in relation to the average value?
-The area under a graph represents the signed sum of the function values over the interval, and dividing this area by the width of the interval yields the average value of the function, reflecting the average height or slope of the graph.
How can you determine the number of samples if you know the spacing between them and the interval length?
-You can determine the number of samples by dividing the length of the interval by the spacing between samples (dx). If the interval does not divide evenly by the spacing, round down to the nearest integer.
What is the general process for finding the average value of a function over an interval?
-To find the average value of a function over an interval, you calculate the integral of the function over the interval, divide it by the width of the interval (b - a), and then evaluate the antiderivative of the function at the bounds of the interval to find the change in height, which gives you the average slope or value.
How does the concept of adding up multiple values relate to integrals in a continuous context?
-In a continuous context, the idea of adding up multiple values can be generalized by integrating the function over an interval, which is equivalent to summing the product of the function and an infinitesimally small width (dx) across the interval.
Outlines
📊 Understanding Averages and Integrals
This paragraph introduces the concept of finding the average of a continuous variable, specifically using the sine function over a period. It explains how integrals and derivatives are inverse operations, with integrals being used to find areas under curves. The discussion focuses on the average height of the sine function graphed between 0 and pi, relating it to real-world phenomena like the sun's daily hours. The paragraph outlines the process of approximating the average by sampling finite points and how this concept leads to the use of integrals when dealing with continuous variables.
📈 Calculating the Average of a Function
This paragraph delves into the calculation of the average height of a graph, using the sine function as an example. It explains how the average can be found by dividing the area under the curve by the width of the interval. The paragraph guides through the process of evaluating the integral of sine between 0 and pi, using the antiderivative (negative cosine). It concludes with the finding that the average value is 2 divided by pi, highlighting the relationship between the area under the curve and the slope of the antiderivative graph.
🔄 The Connection Between Antiderivatives and Integrals
The final paragraph emphasizes the connection between antiderivatives and integrals in solving average problems. It explains how the average of a function over an interval can be found by looking at the change in the antiderivative's height over that interval. The paragraph reinforces the idea that integrals can be used to approximate averages by breaking down a problem into smaller, more manageable parts. It also encourages recognizing situations where integrals can be applied, especially in probability, and appreciates the contributors to the video content.
Mindmap
Keywords
💡Integration
💡Average
💡Continuous Variable
💡Sine Function
💡Antiderivative
💡Derivatives
💡Area
💡Interval
💡Sample Points
💡dx
💡Negative Cosine
Highlights
The discussion focuses on finding the average of a continuous variable and its relation to integrals and derivatives.
The average height of the sin(x) graph on the interval from 0 to pi is explored, which has applications in modeling cyclic phenomena.
The concept of averaging a continuous variable is introduced, which involves infinitely many values unlike finite averages.
The method of approximating the average with finite sums is explained, using evenly spaced points along a range.
The connection between the average value and the integral of sin(x) between 0 and pi is discussed.
The integral is described as the sum of sin(x) times dx, with dx representing the spacing between samples.
The expression for the average is reframed in terms of dx, leading to a numerator that resembles an integral expression.
The average height of the graph is explained as the area divided by its width, providing an intuitive understanding.
The process of solving the integral of sine between 0 and pi is outlined, involving finding an antiderivative of sine.
The antiderivative of sine is identified as negative cosine, and its graph is used to visualize the integral.
The area under the sine graph is found to be 2, and the average height problem is solved as 2 divided by pi.
The relationship between integrals and derivatives as inverse operations is explored through the average value problem.
The average value of a function on an interval is calculated as the integral of the function divided by the interval's width.
The concept of signed area and its relevance to the usual notion of finite averages is discussed.
The process of evaluating an integral involves finding an antiderivative and calculating the change in height between interval bounds.
The antiderivative graph's slope between endpoints is identified as the solution to the average problem.
The video encourages recognizing the sensation of generalizing finite concepts to infinite continuous ranges using integrals.
The practical application of integrals in probability and the importance of remembering this concept are highlighted.
Transcripts
Browse More Related Video

Average Value of a Continuous Function on an Interval

Mean value theorem for integrals | AP Calculus AB | Khan Academy

An Intuitive Understanding of the Fundamental Theorem of Calculus
Average Value of a Function Over an Interval - Calculus
Math 11 - Section 4.4

Calculus: Average Value of a Function (Section 6.5) | Math with Professor V
5.0 / 5 (0 votes)
Thanks for rating: