Average Value of a Continuous Function on an Interval
TLDRThe video script delves into the concept of calculating the average value of a function over a given interval. It begins by explaining the geometric interpretation of the average of a list of numbers, using rectangles to represent the sum of areas under points on a graph. The script then extends this idea to functions, illustrating how to approximate the average by using a series of points and rectangles. As the number of points increases, the approximation improves, leading to the introduction of the average value theorem, which states that the average value of a function can be found by integrating the function over an interval and dividing by the length of that interval. The script provides a clear geometric interpretation of this theorem, showing how the average value creates a rectangle with the same area as the region under the curve of the function. Finally, an example calculation is performed to find the average value of x squared over the interval from 0 to 2, resulting in 4/3. This summary encapsulates the key points of the script, highlighting the geometric approach to understanding the average value of functions.
Takeaways
- 📊 The average of a list of numbers is computed by summing the numbers and dividing by the count.
- 📈 To extend the concept of an average to a function, one can use a geometric interpretation involving rectangles whose areas represent the function's values.
- 🔢 The average of a function is approximated by dividing the area under the curve of the function by the width of the interval.
- 📐 The width of the rectangles (Δx) in the approximation is determined by the interval (B - A) divided by the number of subdivisions (M).
- ∑ The general formula for the average value of a function over an interval is the sum of the function values at each subdivision point, multiplied by Δx, and divided by (B - A).
- 🚀 As the number of subdivisions (M) increases, the approximation of the average value becomes more accurate, approaching the integral value.
- ∫ The average value of a function over an interval is equivalent to the integral of the function over that interval, divided by the width of the interval (B - A).
- 🔼 The average value of a function creates a horizontal line (f_avg) that divides the area under the curve into two equal parts, with regions above and below the line having equal areas.
- 📉 The average value is sensitive to the interval chosen; changing the interval (A and B) results in a different average value.
- 📋 The geometric interpretation shows that the average value replaces the area under a curve with a rectangle of the same area, simplifying the shape.
- 🧮 An example computation is provided for the function f(x) = x^2 over the interval [0, 2], resulting in an average value of 4/3.
- 📘 The video script provides a comprehensive understanding of how to define, compute, and interpret the average value of a function on a given interval.
Q & A
What is the basic concept of calculating the average of a list of numbers?
-The average of a list of numbers is calculated by summing all the numbers and then dividing by the count of the numbers.
How is the concept of the average of a function geometrically interpreted?
-The average of a function is geometrically interpreted by plotting the function's values as points on a graph and then constructing rectangles that span from the x-axis to these points. The sum of the areas of these rectangles represents the average value of the function over the interval.
What is the general formula for the average value of a function over an interval?
-The general formula for the average value of a function over an interval [a, b] is given by (1/(b-a)) * ∫ from a to b of f(x) dx, where f(x) is the function and the integral represents the area under the curve from a to b.
How does the choice of points affect the approximation of the average value of a function?
-The choice of points affects the approximation by allowing for a more granular representation of the function. More points generally lead to a better approximation, but the width of the rectangles (Δx) used in the approximation becomes smaller as more points are added.
What is the significance of the width (Δx) in the approximation of the average value of a function?
-The width (Δx) is significant because it determines the granularity of the approximation. A smaller Δx means that the rectangles used in the approximation are narrower, which can lead to a more accurate representation of the average value of the function.
How does the average value of a function relate to the integral of the function?
-The average value of a function is related to the integral of the function as it is the integral of the function over an interval divided by the width of the interval. In the limit as the number of subdivisions (n) approaches infinity, the sum of the areas of the rectangles approximates the integral of the function.
What does the horizontal line representing the average value (f_average) on the graph signify?
-The horizontal line representing the average value (f_average) signifies a level where the total area above and below this line is equal. It effectively divides the area under the curve into two equal parts, showing that the positive and negative deviations from the average value balance each other out.
How does changing the interval [a, b] affect the average value of a function?
-Changing the interval [a, b] can significantly affect the average value of a function because the average value is computed over a specific range. Different intervals may encompass different parts of the function's curve, leading to different areas under the curve and thus different average values.
What is the geometric interpretation of the difference between the function and its average value?
-Geometrically, the difference between the function and its average value is represented by the shaded areas above and below the horizontal line of average value. The sum of these areas must be zero, indicating that the areas where the function is above its average are equal in size to the areas where it is below its average.
Can you provide an example of how to compute the average value of a function?
-Yes, for example, to compute the average value of the function f(x) = x^2 over the interval [0, 2], you would use the formula (1/(2-0)) * ∫ from 0 to 2 of x^2 dx, which evaluates to (1/2) * (2^3 / 3) - (0^3 / 3), resulting in an average value of 4/3.
Why is it important to consider the interval when discussing the average value of a function?
-The interval is important because the average value of a function is defined over a specific range. The function's behavior can vary greatly over different intervals, and thus the average value can change significantly depending on the chosen interval.
Outlines
📊 Understanding Averages Geometrically
The paragraph introduces the concept of calculating the average of a list of numbers and extends this idea to the average of a function. It explains this through a geometric interpretation by plotting points on a graph and using rectangles to represent the sum of the y-values. The average is found by dividing the total area under these rectangles by the number of rectangles, which is equivalent to the integral of the function over an interval divided by the length of the interval. The paragraph also discusses how the choice of points and the width of the rectangles (Δx) can affect the approximation of the average.
📈 Average Value of a Function on an Interval
This paragraph delves into the concept of the average value of a function over a given interval. It explains how the average value can be visualized as a horizontal line that divides the area under the curve of the function into two equal parts. The average value is calculated by integrating the function over the interval and then dividing by the length of the interval. The paragraph also emphasizes the sensitivity of the average value to the choice of the interval endpoints (a and B). Finally, it provides a specific example of calculating the average value of the function x^2 over the interval from 0 to 2, resulting in an average value of 4/3.
Mindmap
Keywords
💡Average
💡Geometric Interpretation
💡Function
💡Integral
💡Subdivisions
💡Rectangle Approximation
💡Sigma Notation
💡Delta X (Δx)
💡Interval
💡F of X (f(x))
💡Area Under the Curve
Highlights
The average of a list of numbers is calculated by summing the numbers and dividing by the count.
Geometric interpretation of the average involves creating rectangles with bases of equal width and heights equal to the list values.
The concept of the average of a function is introduced as an extension of the average of a list of numbers.
The average of a function is approximated by using a series of points and rectangles to represent the function's values.
The width of the rectangles in the approximation is determined by the interval divided by the number of subdivisions.
The average value of a function is the sum of the function values at the points, multiplied by the reciprocal of the number of subdivisions.
The average value formula can be simplified by replacing the reciprocal of the number of subdivisions with the width of the interval divided by the total width.
The sum of the areas of the rectangles approximates the integral of the function, which is the exact average in the limit as the number of subdivisions approaches infinity.
The average value of a function on an interval is represented by a horizontal line that has the same area as the area under the curve of the function.
Changing the interval (a and b) of the function affects the average value, indicating the importance of specifying the interval for the average calculation.
The average value divides the function's graph into regions above and below the average line, with equal areas.
The integral of the difference between the function and its average value over the interval is zero, indicating balance between positive and negative contributions.
A practical computation example is provided, calculating the average value of x squared over the interval from 0 to 2.
The integral of x squared from 0 to 2 is calculated as (2^3 - 0^3) / 3, resulting in the average value of 4/3.
The video concludes by emphasizing the definition of the average value of a function on an interval and its geometric interpretation.
The average value provides a simple rectangle that replaces the area under a curve with equal total area.
The average value formula is derived from the integral of the function over the interval divided by the width of the interval.
Transcripts
Browse More Related Video
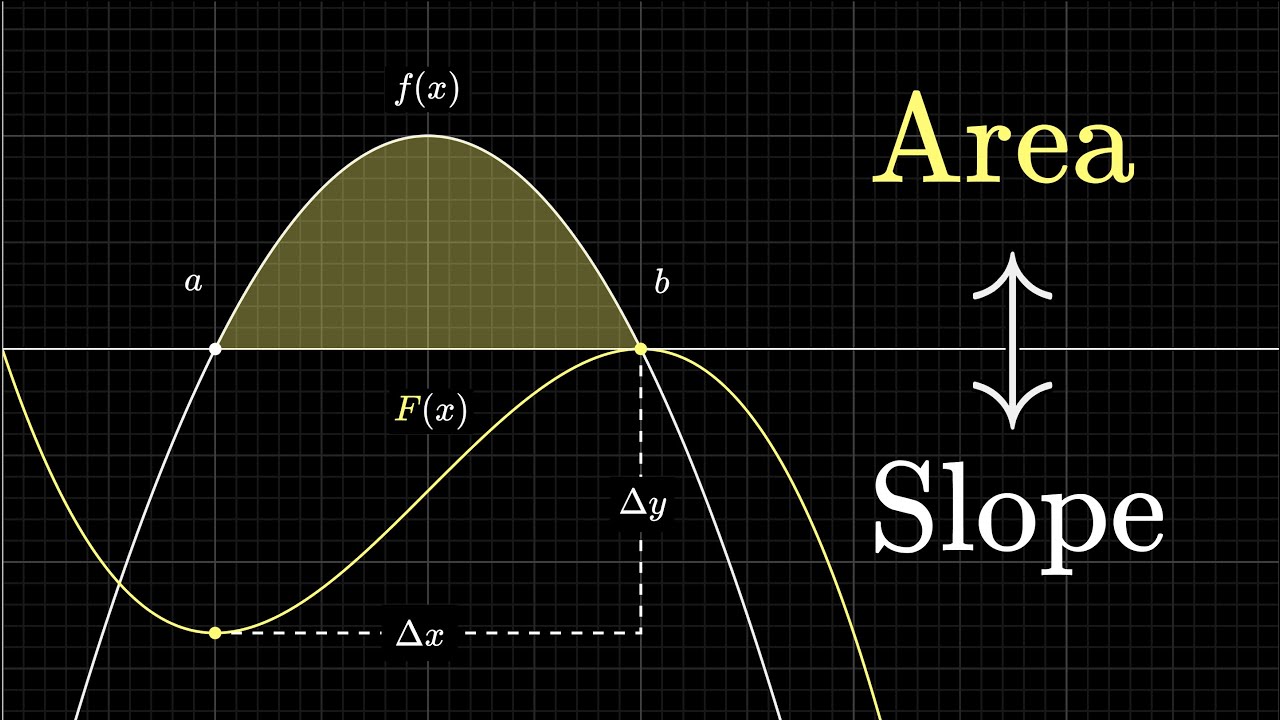
What does area have to do with slope? | Chapter 9, Essence of calculus

An Intuitive Understanding of the Fundamental Theorem of Calculus
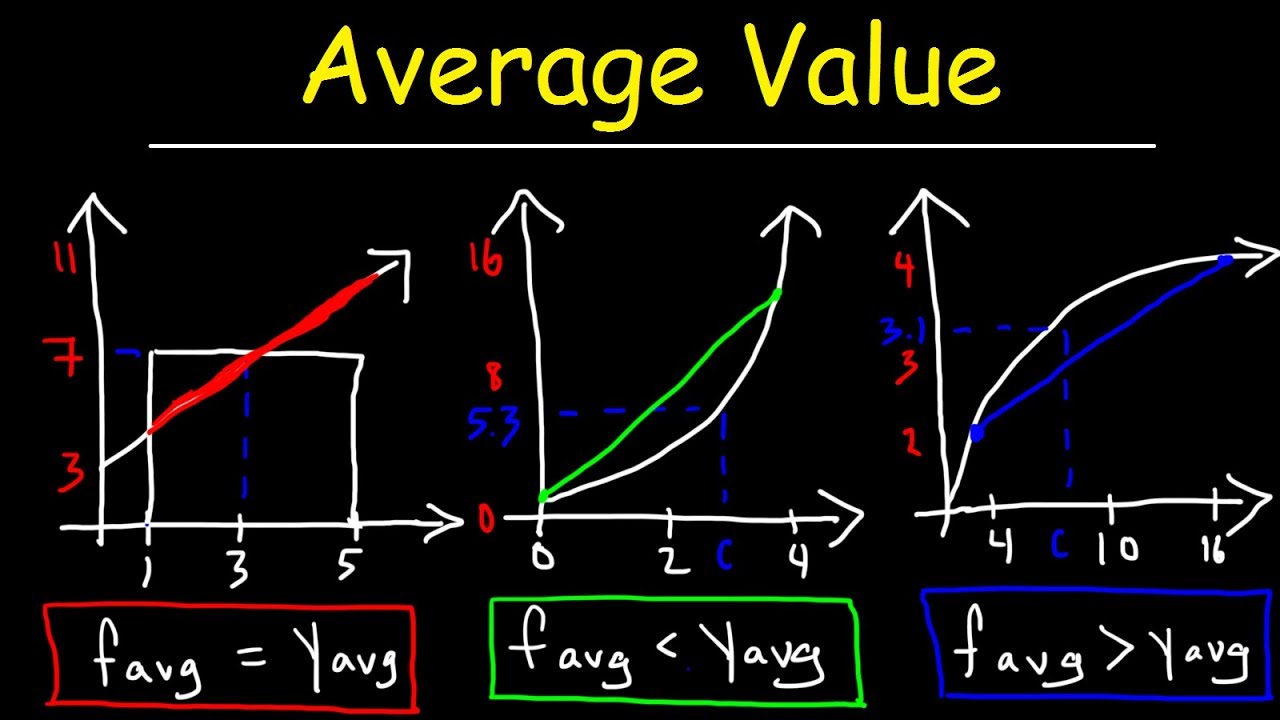
Average Value of a Function Over an Interval - Calculus
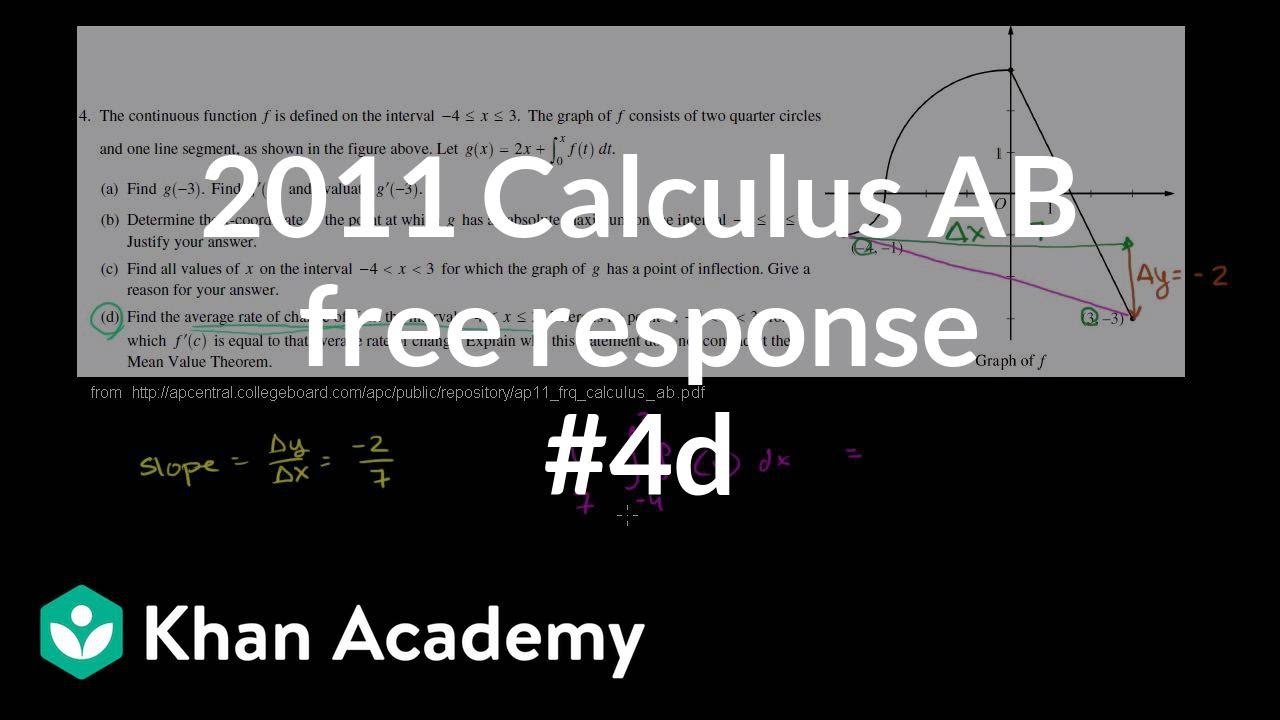
2011 Calculus AB free response #4d | AP Calculus AB | Khan Academy

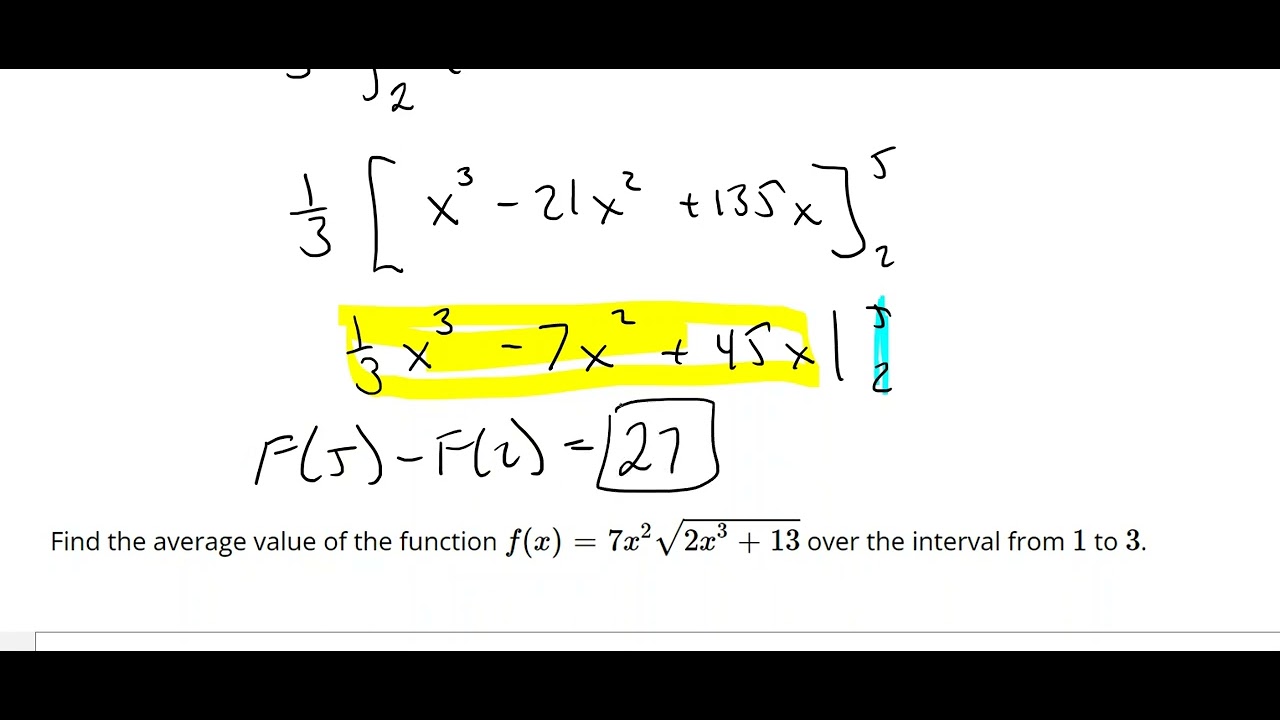
Calculus: Average Value of a Function (Section 6.5) | Math with Professor V
Average Value of a Function
5.0 / 5 (0 votes)
Thanks for rating: