Normal Distribution & Probability Problems
TLDRThis video script delves into the concept of the normal distribution, illustrating the bell-shaped curve and its significance in statistics. It explains the 68-95-99.7 rule, detailing the probabilities of events occurring within one, two, and three standard deviations from the mean. The script provides a practical application by solving problems related to test scores in a physics class, demonstrating how to calculate percentages and numbers of students within certain score ranges using both the empirical rule and calculus-based integration. The video concludes with a guide on using an online calculator for more precise calculations, emphasizing the importance of understanding the normal distribution in statistical analysis.
Takeaways
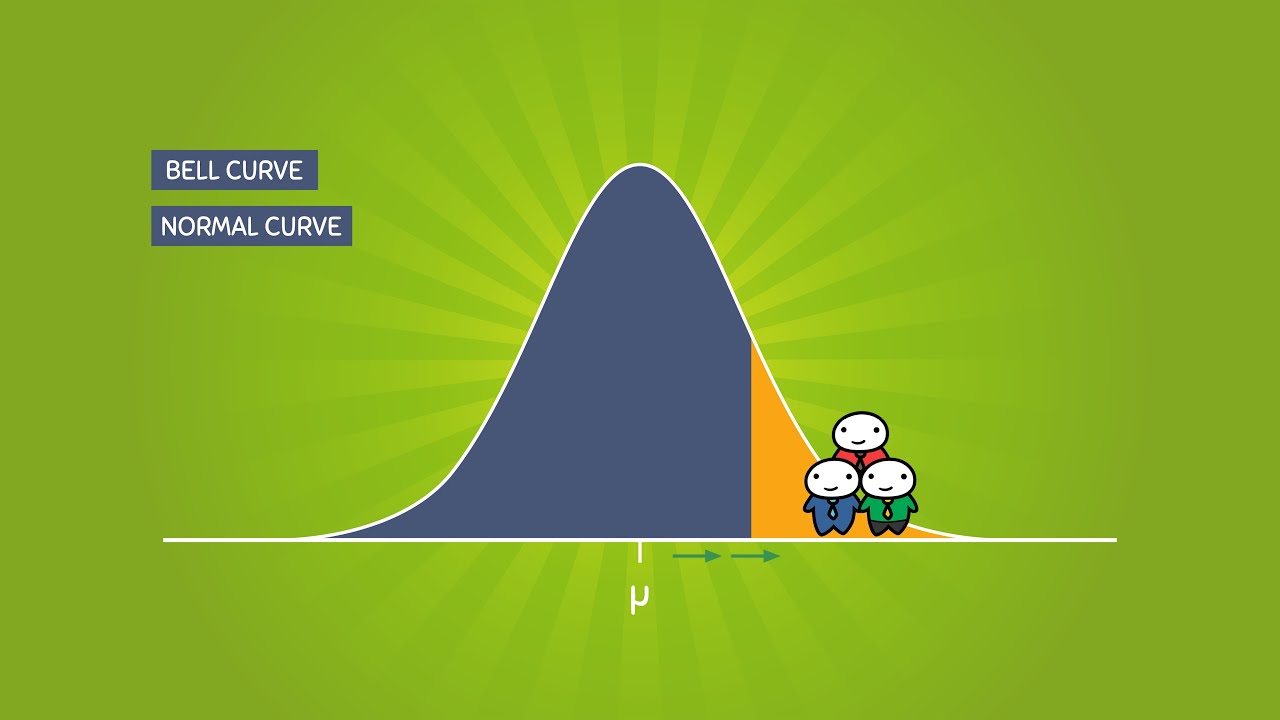
- 📚 The video discusses the normal distribution, also known as the bell-shaped curve, and its significance in statistics.
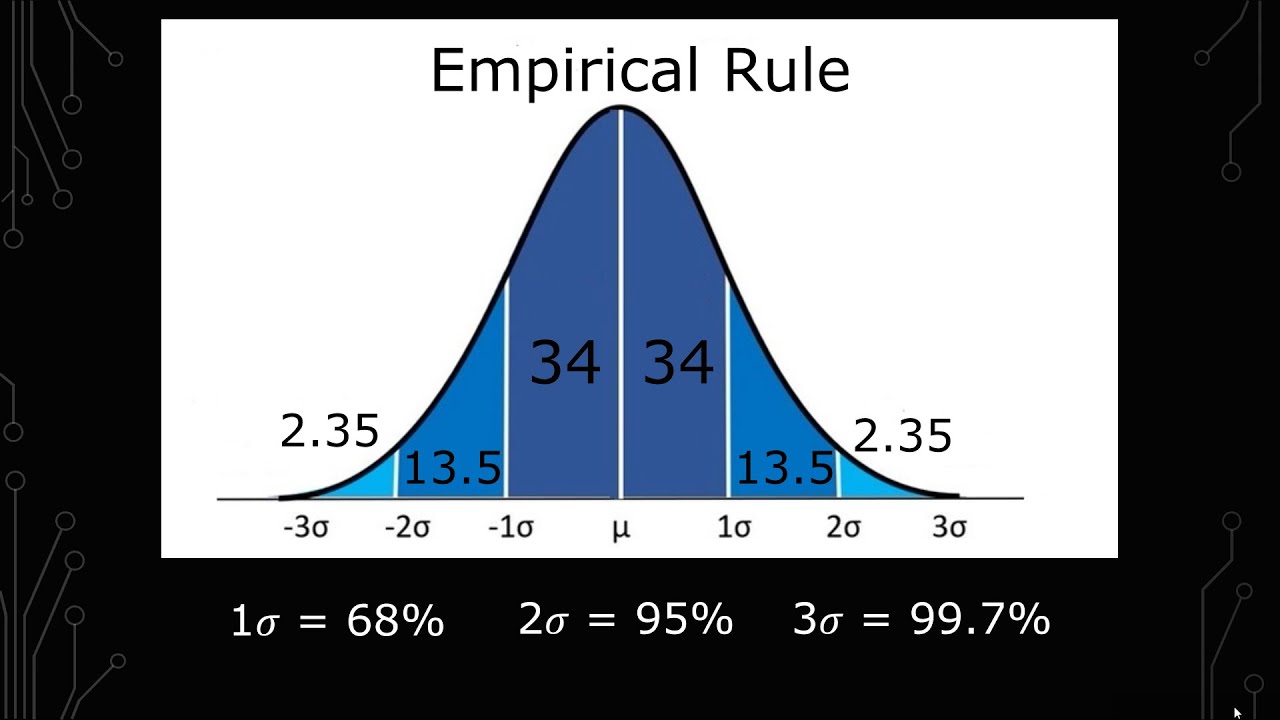
- 📉 The population mean (μ) and standard deviation (σ) are central to understanding the normal distribution curve, with μ at the center and σ indicating the spread.
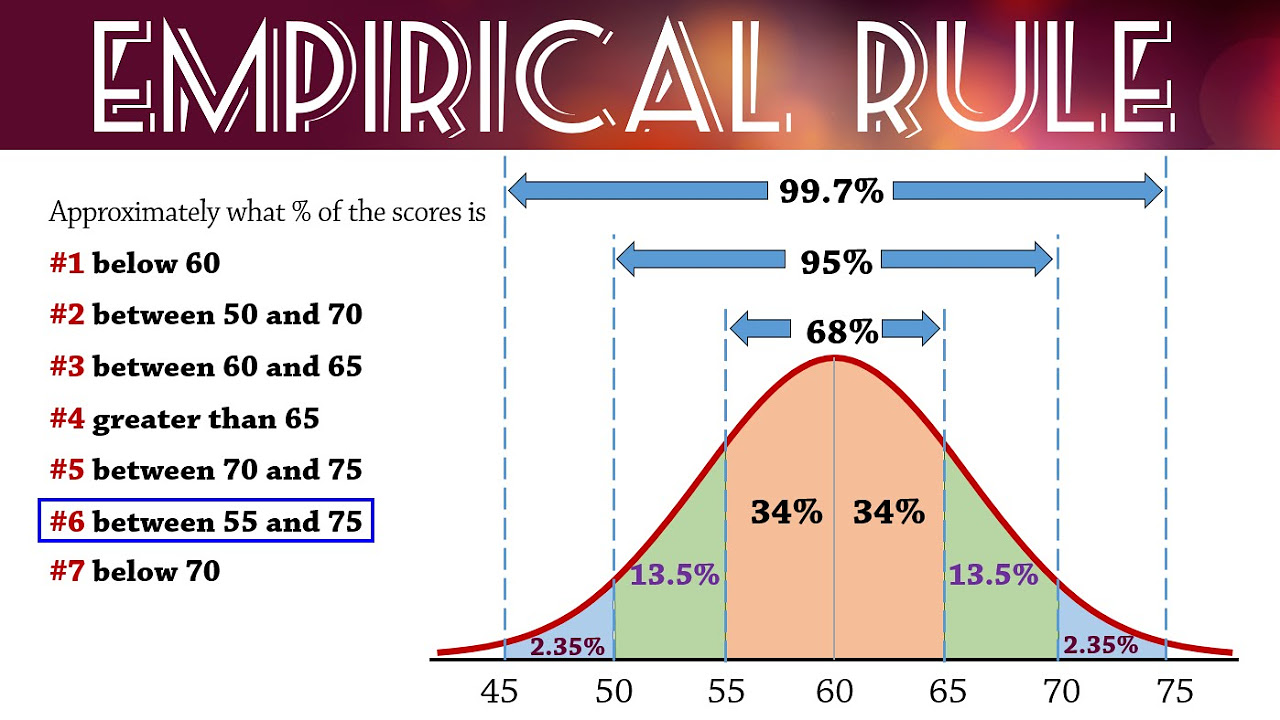
- 🔢 The 68-95-99.7 rule is crucial for the normal distribution, stating that approximately 68.26% of data falls within one standard deviation of the mean, 95.45% within two, and 99.73% within three.
- 📊 The area under the curve represents the probability of an event occurring within a certain range, and the video explains how to calculate these probabilities.
- 📈 The video breaks down the percentages for the regions within one, two, and three standard deviations from the mean, providing exact figures for each segment.
- 🧩 The symmetry of the normal distribution curve allows for easy calculation of probabilities on either side of the mean by dividing the total percentage by two.
- 📝 The video emphasizes the importance of noting these percentages for solving problems related to the normal distribution.
- 🔍 The definite integral of the normal distribution function is introduced as a method for calculating exact probabilities, using calculus and a calculator or an online tool like Wolfram Alpha.
- 📚 Practice problems are presented to demonstrate the application of the normal distribution in calculating percentages and numbers of students scoring within certain ranges on a test.
- 🤔 The video provides a step-by-step guide on how to use the normal distribution to solve for the number of students scoring within specific ranges, emphasizing the use of accurate calculations over approximations.
- 🔧 The use of an online calculator for definite integrals is recommended for obtaining more precise probabilities, with a demonstration of how to input the function into Wolfram Alpha for calculation.
Q & A
What is the normal distribution and why is it significant?
-The normal distribution, also known as the Gaussian distribution or bell-shaped curve, is a continuous probability distribution that is symmetric about the mean, showing the distribution of data points around the average value. It is significant because it is widely used in statistics to model real-valued random variables that cluster around the mean, and it is the basis for many statistical tests and procedures.
What is the population mean (mu) in the context of the normal distribution?
-In the context of the normal distribution, the population mean (mu, μ) is the central value around which all the data points are distributed symmetrically. It represents the average value of the entire population.
What is the standard deviation (Sigma) in the normal distribution?
-The standard deviation (Sigma, σ) is a measure of the amount of variation or dispersion in a set of values in the normal distribution. It indicates how far from the mean (mu) the data points are spread out. One standard deviation away from the mean covers approximately 68.26% of the data points.
What is the 68-95-99.7 rule in relation to the normal distribution?
-The 68-95-99.7 rule, also known as the empirical rule, states that in a normal distribution, approximately 68.26% of the data falls within one standard deviation of the mean, 95.45% falls within two standard deviations, and 99.73% falls within three standard deviations.
How can you calculate the probability of an event occurring between the mean and one standard deviation using the normal distribution?
-The probability of an event occurring between the mean and one standard deviation can be calculated by using the symmetry of the normal distribution curve. It is approximately 34.134% on each side of the mean, totaling 68.268%.
What is the probability of an event occurring between the first and second standard deviations in a normal distribution?
-The probability of an event occurring between the first and second standard deviations is approximately 13.592% on each side of the mean, totaling 27.184%.
How can you estimate the percentage of students scoring between certain ranges in a normally distributed test score dataset?
-You can estimate the percentage by identifying the range on the normal distribution curve that corresponds to the test score range and then applying the empirical rule or using the calculated probabilities for each standard deviation range.
What is the formula for calculating the exact probability between two values (a and b) in a normal distribution using calculus?
-The exact probability between two values (a and b) in a normal distribution is calculated using the definite integral from a to b of the probability density function, which is e^{(-\frac{(x-\mu)^2}{2\sigma^2})} divided by \sigma\sqrt{2\pi}, where μ is the population mean, σ is the standard deviation, and dx represents the differential element.
How can you find the number of students scoring within a specific range in a normally distributed test score dataset with a given total number of students?
-First, calculate the percentage of students scoring within the specific range using the normal distribution probabilities. Then, multiply this percentage by the total number of students to find the approximate number of students within that range.
What is the significance of using an online calculator like Wolfram Alpha for calculating probabilities in the normal distribution?
-An online calculator like Wolfram Alpha can provide more accurate probabilities by evaluating the definite integral of the normal distribution's probability density function between specific limits, especially when dealing with ranges that extend to infinity or require high precision.
Outlines
📊 Introduction to the Normal Distribution
This paragraph introduces the concept of the normal distribution, also known as the bell curve. It explains the significance of the population mean (mu) and standard deviation (sigma) in the context of the curve. The paragraph also covers the empirical rule, which states that approximately 68.2% of data falls within one standard deviation of the mean, 95.4% within two standard deviations, and 99.7% within three standard deviations. The importance of these percentages is emphasized for solving problems related to the normal distribution.
📚 Applying the Normal Distribution to Test Scores
The second paragraph delves into applying the normal distribution to a practical example: the test scores of a physics class with 800 students. It demonstrates how to calculate the percentage of students scoring within a certain range of the mean, using both the empirical rule and a more precise calculus-based approach. The paragraph illustrates the process of finding the percentage of students with scores between 68 and 82, highlighting the use of the normal distribution curve and the integral formula for a more accurate calculation.
🔍 Calculating the Number of Students within a Score Range
This paragraph continues the example from the previous one, focusing on determining the number of students who scored between 61 and 89. It explains how to find the percentage of students within this range by adding the probabilities of the respective regions under the normal distribution curve. The paragraph also shows how to use calculus to confirm this percentage and then convert it into an actual number of students by applying it to the total class size of 800.
🎯 Estimating Scores Beyond a Certain Threshold
The fourth paragraph discusses the probability of a student scoring within a specific range, such as between 54 and 75, and then extends the discussion to estimating the number of students scoring above a certain threshold, like 96 or more. It explains the process of adding the probabilities of the relevant regions under the curve and using calculus to find a more accurate probability. The paragraph also addresses the challenge of integrating to infinity and suggests using a large number as an approximation for infinity.
📘 Utilizing Calculus for Normal Distribution Problems
This paragraph provides a detailed explanation of how to use calculus to solve problems related to the normal distribution. It outlines the integral formula for calculating the probability of an event occurring between two points and demonstrates how to plug in the population mean, standard deviation, and the limits of integration into a calculator or an online tool like Wolfram Alpha to find the exact probability.
🌐 Online Tools for Calculating Normal Distribution
The final paragraph of the script provides guidance on using online calculators, specifically Wolfram Alpha, to calculate probabilities and solve problems related to the normal distribution. It walks through the process of entering the integral expression into the calculator, adjusting the limits of integration for different parts of the problem, and obtaining the probability. The paragraph emphasizes the importance of using accurate and large enough numbers to approximate infinity when necessary.
Mindmap
Keywords
💡Normal Distribution
💡Bell-Shaped Curve
💡Population Mean (Mu)
💡Standard Deviation (Sigma)
💡Empirical Rule
💡Probability
💡Symmetry
💡Continuous Random Variable
💡Definite Integral
💡Wolfram Alpha
💡Approximation
Highlights
Introduction to the normal distribution and the bell-shaped curve concept.
Explanation of the population mean (mu) and standard deviation (sigma) in the context of the normal distribution.
Visualization of one, two, and three standard deviations from the mean on the normal distribution curve.
The area under the curve represents the probability of an event occurring between two points.
The 68-95-99.7 rule for probabilities within one, two, and three standard deviations from the mean.
Calculation of the percentage of events occurring between the mean and one standard deviation.
Symmetry in the normal distribution curve and its implications for probability calculations.
Method to find the percentage of events between the first and second standard deviations.
Process to determine the percentage of events within three standard deviations of the mean.
Importance of understanding the total probability and area under the curve in a normal distribution.
Application of the normal distribution to solve problems involving test scores and standard deviations.
Use of the definite integral in calculus to find more accurate probabilities in a normal distribution.
How to calculate the percentage of students scoring within a specific range using the normal distribution.
Conversion of probabilities to actual numbers of students based on the total class size.
Approach to find the probability of a student scoring above a certain threshold using the normal distribution.
Demonstration of using an online calculator for definite integrals to solve normal distribution problems.
Final summary of how to apply the normal distribution curve to practical problems in statistics.
Transcripts
Browse More Related Video
Empirical Rule (68-95-99.7) for Normal Distributions

Elementary Statistics - Chapter 6 Normal Probability Distributions Part 1
How to Use the Empirical Rule with Examples

Empirical Rule of Standard Deviation in Statistics
The Normal Distribution and the 68-95-99.7 Rule (5.2)

What is a Bell Curve or Normal Curve Explained?
5.0 / 5 (0 votes)
Thanks for rating: