Factorial: Main Effects and Interaction Online 2
TLDRThis script delves into factorial designs, focusing on main effects and interactions. It explains how main effects represent the impact of a single variable, as if other variables were absent, using examples like drug dosage and age on symptomology. Interaction effects illustrate combined influences of variables, differing from individual main effects. The script uses various examples and hypothetical data to clarify these concepts, emphasizing the importance of statistical tests to confirm significance and the potential issues with floor and ceiling effects in interpreting interactions.
Takeaways
- 📚 A factorial design in research involves studying the effects of two or more independent variables on a dependent variable.
- 🔍 The main effect is the impact of a single independent variable on the dependent variable, as if it were the only variable being studied.
- 🤔 Interaction effects occur when the effect of one independent variable changes depending on the level of another independent variable.
- 👶 The example given in the script includes a study on the impact of picture book versions and grade levels on children's body dissatisfaction.
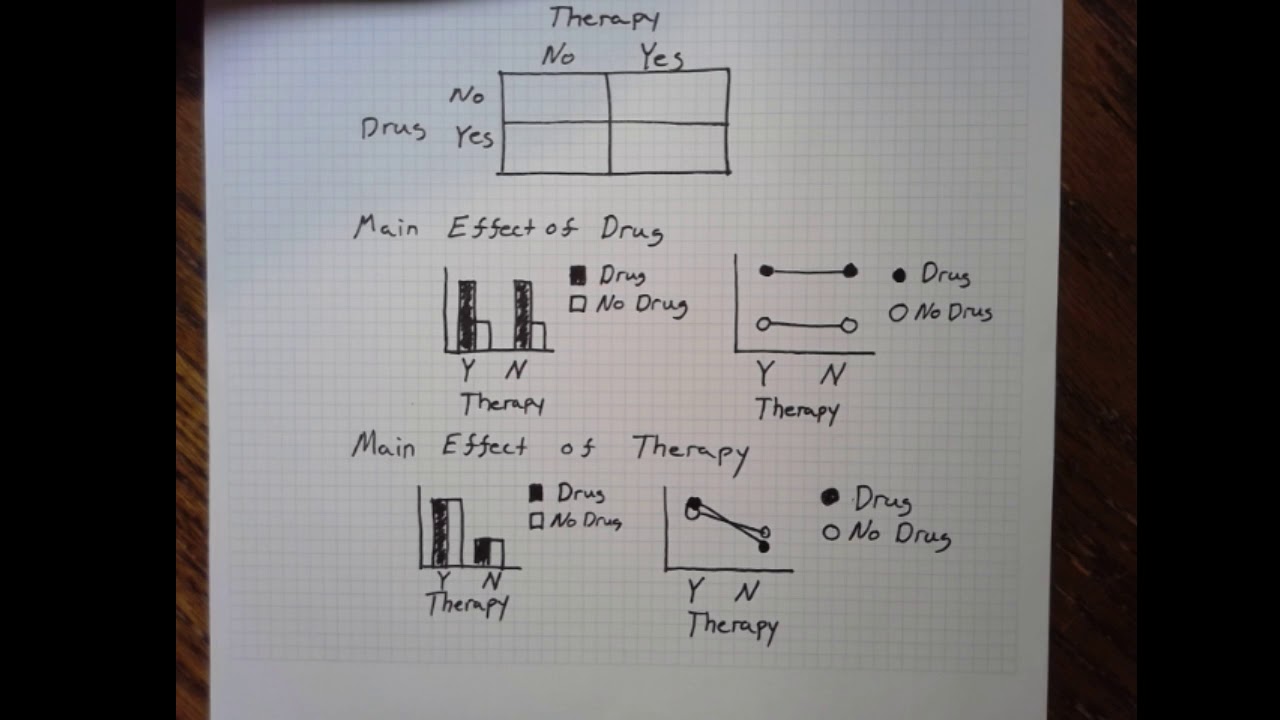
- 📊 To determine main effects, one should look at the average impact of each independent variable separately, ignoring the others.
- 🔬 Interactions are identified by examining whether the main effects can fully explain the differences observed in individual cells of the data set.
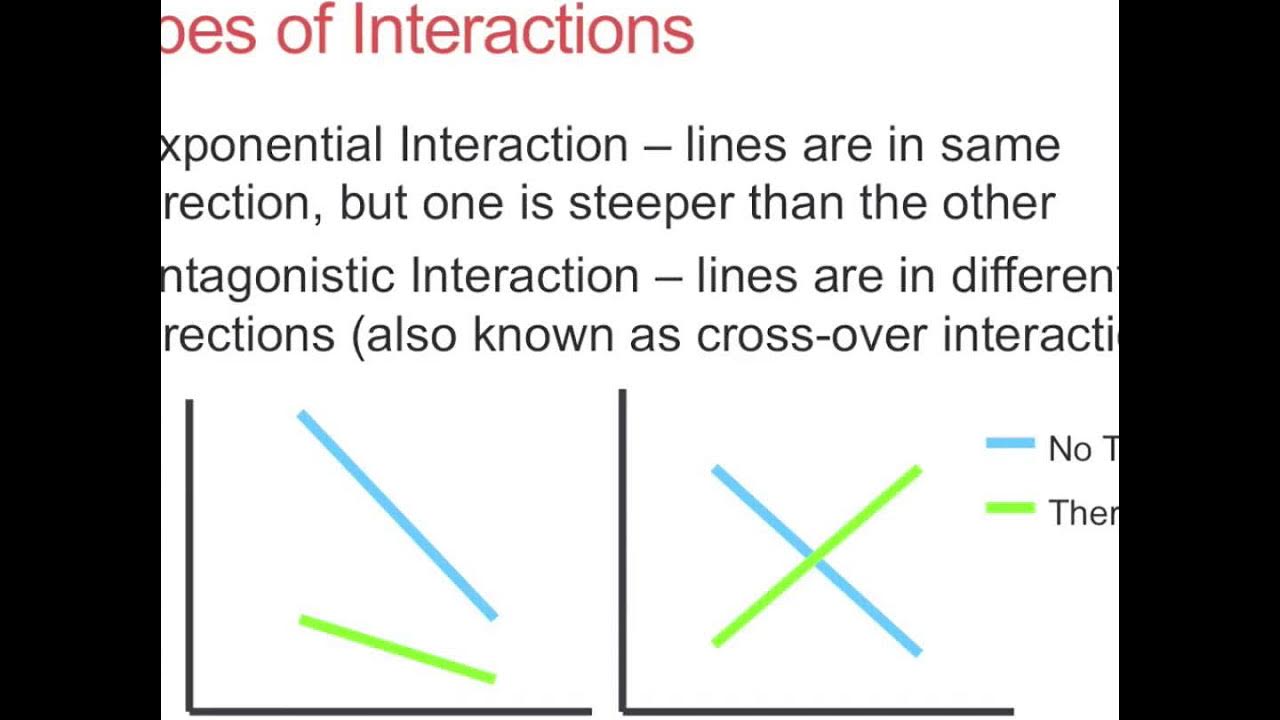
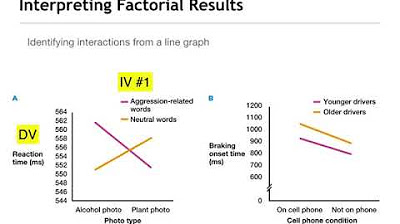
- 📈 Graphs can be a powerful tool for visually detecting interactions, as non-parallel lines (crossing, converging, or diverging) indicate an interaction.
- 🔍 To check for interactions, compare the differences within individual cells to the differences indicated by the main effects outside those cells.
- 📉 Floor and ceiling effects can create the illusion of interactions. If the means of conditions are near the highest or lowest possible scores, the interpretation of interactions is not reliable.
- 📝 The script provides a step-by-step guide on how to analyze data from factorial designs to identify main effects and interactions.
- ⚠️ It is important to conduct statistical tests to confirm whether observed interactions or main effects are statistically significant.
Q & A
What is the main effect in a factorial design?
-The main effect in a factorial design is the overall effect of an independent variable when considering it as if it were the only variable being studied, ignoring the influence of other independent variables.
How does the concept of main effect differ from interaction effect in factorial designs?
-A main effect looks at the impact of a single independent variable on the dependent variable in isolation, whereas an interaction effect occurs when the effect of one independent variable changes depending on the level of another independent variable, indicating a combined influence.
What is an example of a factorial design mentioned in the script?
-An example given in the script is a study looking at the effects of drug dosage and age on symptomology, which is a 2x2 factorial design because there are two independent variables each with two levels.
Can you explain the concept of 'floor' and 'ceiling' effects in the context of factorial designs?
-Floor and ceiling effects occur when the means for one or more conditions are, on average, near the highest possible score (ceiling effect) or the lowest possible score (floor effect), which can limit the ability to detect true interactions or main effects because the scale is not sensitive enough to capture changes.
What is the importance of checking for interactions in factorial designs?
-Checking for interactions is important because it reveals whether the effect of one independent variable is different at different levels of another independent variable, providing a more nuanced understanding of the relationships between variables.
How can one visually determine if there is an interaction effect in a factorial design?
-One can visually determine an interaction effect by graphing the data and observing if the lines representing different levels of one independent variable are not parallel when plotted against another independent variable.
What is the difference between looking at main effects and looking at individual cells in a factorial design?
-Looking at main effects involves collapsing over the other independent variable and examining the average impact of one variable, whereas looking at individual cells involves examining the specific combination of independent variable levels to see if there are unique interactions occurring.
Why is it necessary to perform a statistical test to confirm the presence of an interaction effect?
-A statistical test is necessary to confirm the presence of an interaction effect because visual inspections can suggest potential interactions, but statistical significance must be established to ensure the findings are not due to random chance.
Can you provide an example of how to calculate a main effect from the transcript?
-An example from the transcript is calculating the main effect of 'grade' by taking the average scores of body dissatisfaction for kindergarten, first grade, and second grade as if the picture book version was not a factor in the study.
What is the role of graphing in understanding interactions in factorial designs?
-Graphing plays a crucial role in understanding interactions by visually representing the relationship between independent variables and the dependent variable, making it easier to spot non-parallel lines that suggest an interaction effect.
Outlines
🔍 Exploring Main Effects and Interactions in Factorial Designs
Kristen Atchison delves into factorial designs, focusing on the concepts of main effects and interactions. Main effects represent the overall influence of a single independent variable on the dependent variable, as if it were the only variable in the study. Interaction effects, on the other hand, occur when the impact of one independent variable changes based on the level of another. The speaker uses the example of a study examining drug dosage and age on symptomology to illustrate these concepts. Factorial designs allow researchers to perform two 'mini-experiments' within one, assessing each variable's main effect and their combined interaction effect on the dependent variable.
📊 Analyzing Data for Main Effects and Interactions
The script continues with a detailed explanation of how to analyze data for main effects and interactions within a factorial design. It emphasizes the importance of looking at the means of the dependent variable across different levels of the independent variables, both individually and in combination. The speaker provides hypothetical data examples, such as an alcohol and caffeine study, to demonstrate the process of identifying main effects by comparing average responses and checking for interactions by examining whether the differences observed in the individual cells can be explained by the main effects alone.
📚 Case Study: Barbie and Picture Book Effects on Children
This paragraph presents a case study involving the effects of different versions of a picture book (Barbie or neutral) on children's body dissatisfaction across different grades (kindergarten, first grade, and second grade). The study is structured as a three-by-three factorial design, resulting in nine combinations. The speaker explains how to calculate main effects by averaging results across the other variable and how to identify interactions by comparing the differences within the cells to those expected by the main effects. The case study serves to illustrate the practical application of factorial design analysis in a real-world scenario.
📈 Visualizing Main Effects and Interactions with Graphs
The speaker introduces the use of graphs to visually identify main effects and interactions. By plotting the means of the dependent variable against the levels of the independent variables, it becomes easier to spot interactions when the lines representing different levels of one variable are not parallel. The paragraph includes examples of how to interpret graphs to determine the presence of main effects and interactions, emphasizing that while visual analysis can suggest the presence of an interaction, statistical tests are required to confirm its significance.
🤔 Considerations for Floor and Ceiling Effects in Interaction Analysis
The script discusses potential issues with floor and ceiling effects when analyzing interactions. These effects occur when the means of one or more conditions approach the highest or lowest possible scores, respectively. Such occurrences can lead to misleading interpretations of interactions. The speaker provides an example of a test score analysis that could be affected by a ceiling effect and explains how extending the range of the dependent variable measure can clarify whether an interaction is genuinely present or an artifact of measurement limitations.
📘 Reviewing Main Effects, Interactions, and Statistical Significance
In the final paragraph, the speaker wraps up the discussion by summarizing the key points about main effects and interactions. They remind the audience that while visual and mathematical analyses can suggest the presence of main effects and interactions, statistical tests are essential to determine their significance. The speaker also encourages participants to complete a related question on the learning platform and invites any questions they might have, emphasizing the importance of understanding these concepts in experimental design and data analysis.
Mindmap
Keywords
💡Factorial Design
💡Main Effect
💡Interaction Effect
💡Dependent Variable
💡Independent Variable
💡Ceiling Effect
💡Floor Effect
💡Statistical Significance
💡Hypothetical Data
💡Parallel Lines
Highlights
Main effects in factorial designs represent the overall effect of an independent variable as if it was the only variable studied.
Interaction effects occur when the influence of one independent variable on the dependent variable changes depending on the level of a second independent variable.
Factorial designs allow for the examination of both main effects and interaction effects, providing a comprehensive understanding of variable impacts.
The study on drug dosage and age on symptomology exemplifies how main effects can be isolated for analysis within factorial designs.
Interaction effects can reveal different responses based on the combination of conditions, beyond what main effects alone can explain.
The example of Barbie and neutral picture books across different grades illustrates the application of factorial designs in educational research.
Main effects can be determined by comparing the means of dependent variables across different levels of a single independent variable.
Interaction effects are identified by examining the differences within individual cells of the design matrix against the main effects.
The hypothetical alcohol and caffeine study demonstrates how to assess main and interaction effects through mean comparisons.
Graphical representation of data can visually confirm the presence of interaction effects through non-parallel lines.
The importance of distinguishing between true interaction effects and those that may appear due to floor or ceiling effects in measurement.
The necessity of statistical testing to confirm the significance of observed interactions, beyond just visual or mean-based assessments.
The impact of educational programming versus non-educational on high school grades as an example of main effects in a factorial context.
The method of collapsing data across variables to focus on main effects before examining interactions within the design cells.
Examples of hypothetical data highlighting the absence of effects, main effects, and interactions in factorial designs.
The use of graphical analysis to quickly identify potential interactions through visual inspection of line patterns.
The importance of considering the design and scope of studies to avoid misinterpretation of interactions due to measurement limitations.
Transcripts
Browse More Related Video
Factorial Designs: Main Effects & Interactions
Complex Experiments: 3 - Main effects and interactions
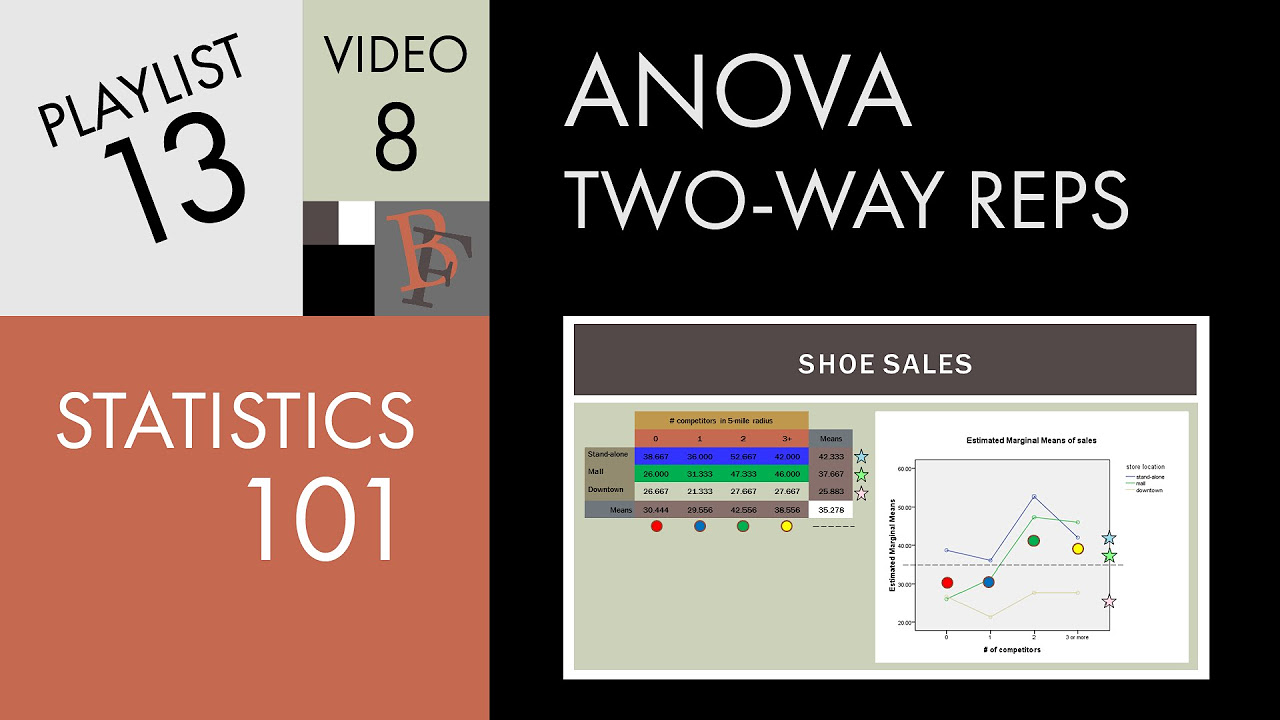
Statistics 101: Two-way ANOVA with Replication, Marginal Means Graphs

Two-Factor Factorial Design Experiments - ANOVA Model

interaction main effect graphs
Factorial Designs Describing Main Effects and Interactions
5.0 / 5 (0 votes)
Thanks for rating: