Two-Factor Factorial Design Experiments - ANOVA Model
TLDRThis lecture by Dr. Garth delves into the concept of two-factor factorial experiments, a statistical method used to assess the impact of multiple variables on a process. Through examples like chemical engineering processes and primer paint application, the video explains how to calculate main effects and interactions between factors. It also covers the construction of ANOVA tables and hypothesis testing to determine significant effects, providing a foundational understanding of factorial designs for statistical analysis.
Takeaways
- 🔬 A factorial experiment is a method used to study the effects of multiple factors on a process or outcome, involving testing all possible combinations of these factors.
- 👨🔬 The script provides an example of a chemical engineer investigating the effects of reaction time and temperature on a process, highlighting the factorial approach to understanding their impact.
- ⏱ The experiment considers different levels for each factor, such as 1 and 1.5 hours for reaction time and 125 and 150 degrees Celsius for temperature, to observe their effects on the process.
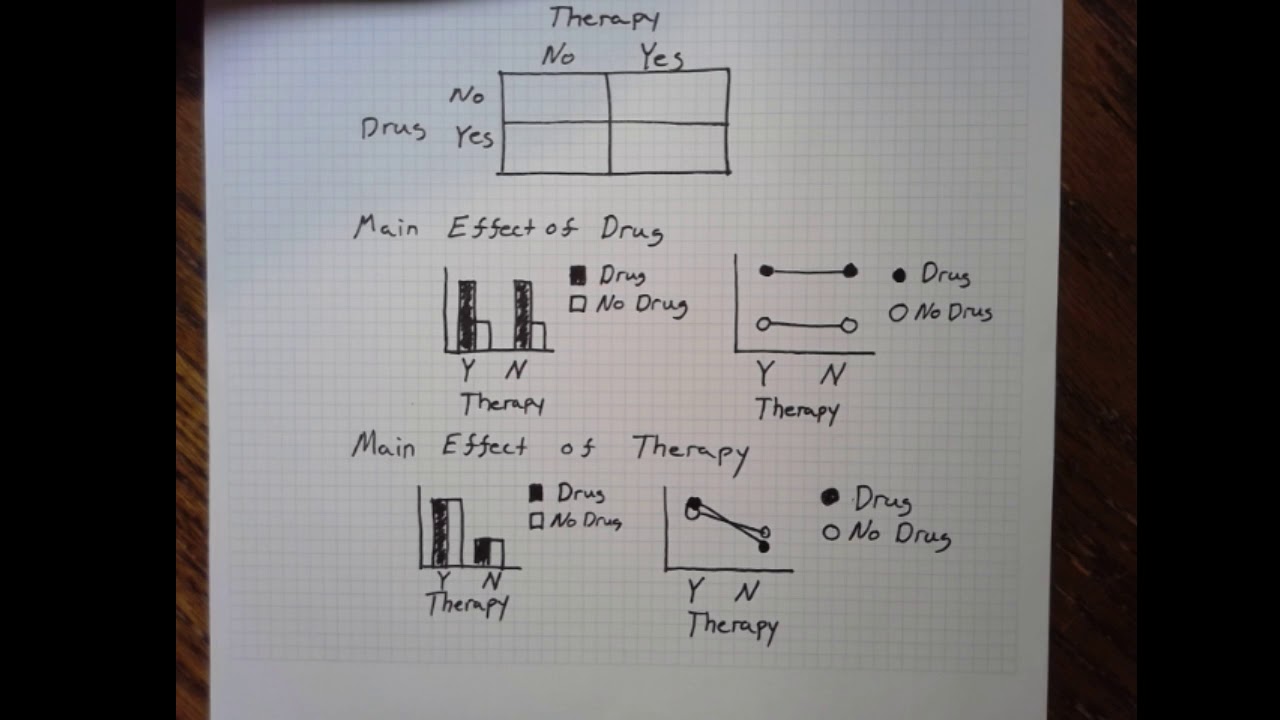
- 📊 Main effects are calculated by determining the average difference between the high and low levels of each factor, indicating how changes in that factor influence the outcome.
- 🔍 Interaction effects are assessed by comparing the diagonal averages of the factorial combinations, revealing whether the impact of one factor changes with the level of another.
- 📚 The script explains that a factorial experiment design is used when there are several factors in an experiment, with each experiment performed at all combinations of the factors.
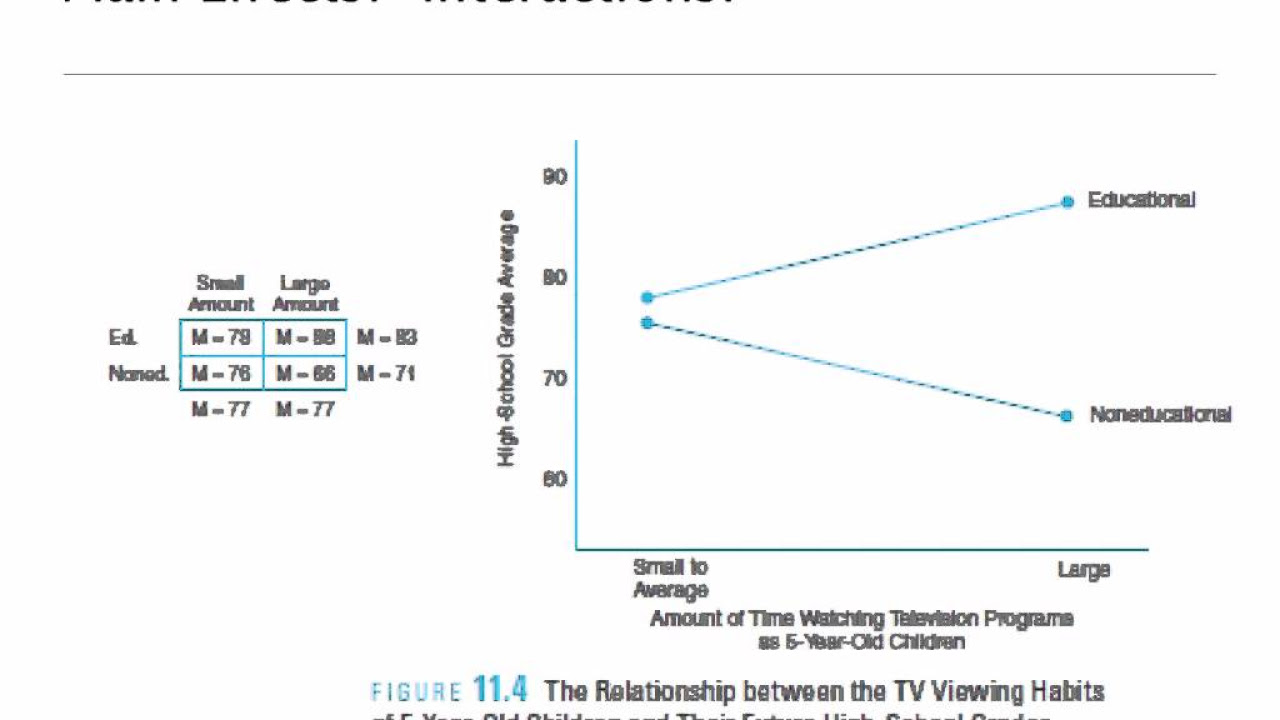
- 📈 The concept of graphical representation is introduced to visually identify whether there is an interaction between factors by observing the parallelism or intersection of lines on a graph.
- 📝 The script outlines the statistical model for a factorial experiment, including the overall mean (mu), main effects (tau and beta), interaction effects, and random error (epsilon).
- 🧐 Hypothesis testing is a crucial part of the factorial experiment, with ANOVA used to determine if there are significant differences between factor levels and their interactions.
- 📉 The script provides a step-by-step guide to calculating the ANOVA table, including sum of squares, mean squares, and F-ratios, which are essential for hypothesis testing.
- 📚 The importance of comparing calculated F-ratios with critical values from the F-distribution table is emphasized to make decisions about the null hypothesis for each factor and interaction.
Q & A
What is a two-factor factorial experiment?
-A two-factor factorial experiment is a study that investigates the effects of two different factors on a process or outcome, with each factor having multiple levels. It involves making observations at all possible combinations of these levels to understand their individual and combined effects.
Can you give an example of a two-factor factorial experiment?
-An example given in the script is a chemical engineer investigating the effect of reaction time (1 hour and 1.5 hours) and reaction temperature (125 degrees Celsius and 150 degrees Fahrenheit) on a chemical process. Observations are made at each combination of these factors.
What are the main effects in a factorial experiment?
-The main effects in a factorial experiment are the average differences between the high and low levels of each factor. They represent the impact of changing one factor from its low level to its high level while keeping the other factor constant.
How do you calculate the main effect for a factor in a factorial experiment?
-The main effect for a factor is calculated by taking the average of the responses at the high level of that factor and subtracting the average of the responses at the low level of the same factor.
What is an interaction effect in a factorial experiment?
-An interaction effect occurs when the response to one factor depends on the level of the other factor. It is calculated by comparing the diagonal averages in the experimental design matrix.
How do you determine if there is no interaction between factors in a factorial experiment?
-If the interaction factor, calculated by comparing the diagonal averages, is zero, it indicates that there is no interaction between the factors. The effects of the factors do not depend on each other.
What is the purpose of a factorial experiment design in statistical analysis?
-The purpose of a factorial experiment design is to efficiently test multiple factors and their interactions simultaneously, providing a comprehensive understanding of how different factors affect an outcome.
Can you explain the concept of fixed effects in the context of factorial experiments?
-Fixed effects in factorial experiments refer to the factors whose levels are chosen by the researcher and are of specific interest in the study. The effects are calculated by removing the grand mean from each factor level's mean, and the goal is to test whether these levels differ significantly.
What is the significance of the ANOVA model in factorial experiments?
-The ANOVA (Analysis of Variance) model is used to test the significance of the main effects and interaction effects in a factorial experiment. It helps determine whether the differences observed are due to chance or are statistically significant.
How do you construct an ANOVA table for a factorial experiment?
-An ANOVA table is constructed by calculating the sum of squares for each factor and their interactions, the mean square (sum of squares divided by degrees of freedom), and then computing the F-ratio (mean square divided by the mean square of the error). This table helps in testing the null hypothesis for each effect.
What is the null hypothesis in the context of a factorial ANOVA?
-The null hypothesis in a factorial ANOVA states that there is no significant difference between the levels of the factors or in their interactions. It is tested against the alternative hypothesis that at least one level or interaction is significantly different.
Outlines
🔬 Introduction to Factorial Experiments
Dr. Garth introduces the concept of factorial experiments, using a chemical engineering example to illustrate how varying reaction times and temperatures can affect a process. The lecture explains the significance of factorial experiments in analyzing multiple factors and their interactions. It defines main effects and interaction effects, and how to calculate them using a simple 2x2 factorial setup. The importance of understanding these effects is emphasized for accurate experimental analysis.
📚 Generalizing Two-Factor Factorial Experiments
This section delves into the generalization of two-factor factorial experiments, explaining how to set up experiments with multiple levels of factors A and B, each with 'n' replicates. The statistical model for such experiments is introduced, including the overall mean (mu), main effects (tau and beta), interaction effect (tau beta), and random error (epsilon). The process of hypothesis testing using ANOVA is outlined, with a focus on defining null and alternative hypotheses for factor levels and interactions.
📉 Calculating ANOVA for Factorial Experiments
The paragraph explains the detailed process of calculating ANOVA for factorial experiments, including determining the sum of squares for factors A and B, and their interaction. It provides a step-by-step guide on how to compute these values, including finding the correction factor (c), and using it to calculate the mean sum of squares. The explanation includes practical examples, such as aircraft primer paints, to demonstrate the application of these calculations in real-world scenarios.
📝 Constructing ANOVA Tables and Hypothesis Testing
This section focuses on constructing ANOVA tables and performing hypothesis testing for factorial experiments. It explains how to calculate the degrees of freedom, sum of squares, and mean squares for factors and interactions. The process of finding F-ratios and comparing them with critical values from the F-distribution table is detailed, with examples to illustrate how to make decisions about the null hypothesis based on these comparisons.
🔍 Examples of Factorial Experiments and ANOVA Application
The paragraph provides several examples of factorial experiments, demonstrating how to apply ANOVA calculations in different scenarios. It includes examples involving different factors such as primer types and application methods, temperatures and copper contents, and machine types and shifts. The examples show how to simplify calculations, construct ANOVA tables, and interpret the results to determine significant effects and interactions.
📈 Conclusion and Future Lectures on Factorial Designs
In conclusion, the paragraph summarizes the process of conducting two-factor factorial experiments and the importance of ANOVA in analyzing the results. It also previews upcoming lectures that will cover more complex factorial designs, such as 2^k factorial experiments. The lecturer encourages students to follow provided links for additional learning resources and wishes them well in their studies.
Mindmap
Keywords
💡Factorial Experiment
💡Main Effect
💡Interaction Effect
💡ANOVA (Analysis of Variance)
💡Null Hypothesis (H0)
💡Factor Levels
💡Degrees of Freedom
💡Sum of Squares (SS)
💡F-Ratio
💡Critical Value
Highlights
Introduction to factorial experiments in probability and statistics.
Example of a chemical engineer investigating reaction time and temperature effects.
Explanation of how to conduct a factorial experiment with two factors.
Different levels of experiments corresponding to factorial design.
Understanding main effects and calculating the impact of factors A and B.
Graphical representation of main effects and interactions.
Definition and calculation of interaction factors between A and B.
Generalization of factorial experiments to more than two factors.
Statistical model definition for factorial experiments using ANOVA.
Hypothesis testing for main effects and interactions in factorial designs.
Fixed effects and their significance in factorial experiments.
Detailed explanation of constructing ANOVA tables and calculating mean squares.
Application of factorial experiments in real-world scenarios like aircraft primer paints.
Demonstration of how to compute F-ratios and compare with critical values.
Interpretation of results from factorial experiments and decision-making.
Examples of factorial experiments with different factors like temperature and copper content.
Strategies to simplify calculations in factorial experiments.
Final thoughts on 2-factor factorial experiments and预告of 2^k factorial design experiments.
Transcripts
Browse More Related Video

2^k Factorial Designs Experiment - ANOVA Model
Factorial Designs: Main Effects & Interactions
Factorial: Main Effects and Interaction Online 2

Full Factorial Design (DoE - Design of Experiments) Simply explained

Learn How Powerful a Design of Experiment (DOE) Can Be When Leveraged Correctly
Statistics 101: Two-way ANOVA with Replication, Marginal Means Graphs
5.0 / 5 (0 votes)
Thanks for rating: