How to Calculate R Squared Using Regression Analysis
TLDRThis tutorial explains the concept of R-squared, a measure of how well a regression line predicts actual values. The presenter demonstrates the calculation of R-squared by comparing the distances of actual and estimated values from their mean. Using a sample dataset, the video illustrates the process of calculating the mean, squaring the deviations, and deriving the regression equation to estimate values. The final R-squared value quantifies the model's goodness-of-fit, with 1 indicating a perfect fit and 0 showing no relationship. The video also teases the next topic: standard error of the estimate.
Takeaways
- 📊 R-squared (R²) is a statistical measure that represents the proportion of the variance for a dependent variable that's explained by an independent variable in a regression model.
- 📈 To calculate R², first determine the mean of the actual values and then find the distances of each actual value from this mean.
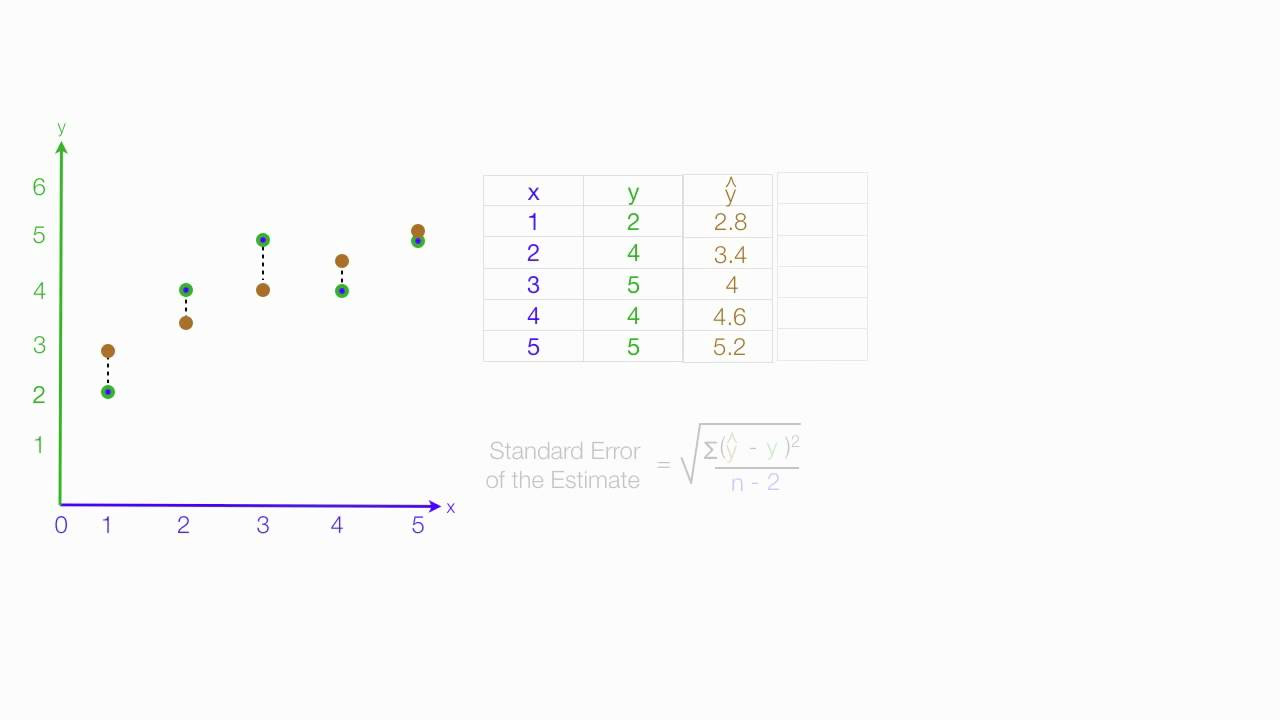
- 📍 The regression line is used to estimate values based on the actual values, and these estimated values are compared to the mean to find their distances.
- 🔢 The sum of the squared distances of the actual values from the mean should equal zero, which serves as a check for the calculations.
- ✍️ The formula for R² involves squaring the differences between the estimated and actual values, and then dividing the sum of these squared differences by the total sum of squares.
- 📐 The script demonstrates the calculation of R² using a specific example with a mean Y value of 4 and a regression equation y = 2.2 + 0.6x.
- 📉 R² values range from 0 to 1, where 0 indicates no relationship between the variables and 1 indicates a perfect fit.
- 📝 The script emphasizes the importance of comparing the distances of the actual values to the mean with the distances of the estimated values to the mean to determine R².
- 📚 The script suggests that further understanding of R² and its implications can be gained by watching additional videos in the playlist.
- 📉 A higher R² value indicates a better fit of the regression model to the data, while a lower value suggests a weaker relationship.
- 🔍 Another measure of goodness-of-fit, the standard error of the estimate, is mentioned as a topic for a future video, indicating the script is part of a series.
Q & A
What does R squared tell us in a regression analysis?
-R squared tells us how well a regression line predicts or estimates actual values.
How do you calculate R squared?
-To calculate R squared, you compare the distance from actual values to their mean with the distance from estimated values (derived from the regression line) to the mean.
What is the first step in calculating R squared?
-The first step is to determine the mean of the actual values.
Why is it significant that the sum of (Y - mean of Y) equals zero?
-The sum equals zero as a way to check your calculations; it ensures that the deviations from the mean are balanced.
What do you do with the values of (Y - mean of Y) in the calculation process?
-You square these values to eliminate negative differences and sum them up to get a total value.
How is the regression line derived?
-The regression line is derived from a formula based on previous calculations, such as y = 2.2 + 0.6 * x.
What are the estimated values used for in the calculation?
-The estimated values are used to find the distances from the regression line to the mean, which are then compared to the distances of actual values to the mean.
What is the final step in calculating R squared?
-The final step is to divide the sum of squared distances of estimated values by the sum of squared distances of actual values to get R squared.
What does an R squared value of 0.6 indicate?
-An R squared value of 0.6 indicates a moderately good fit between the regression line and the actual data.
What happens to the R squared value when the actual and estimated values are close together?
-When the actual and estimated values are close together, the R squared value approaches 1, indicating a better fit.
How does R squared change with large distances between actual and estimated values?
-With large distances between actual and estimated values, the R squared value gets smaller, approaching zero, indicating a poor fit.
What is another way to measure goodness-of-fit besides R squared?
-Another way to measure goodness-of-fit is the standard error of the estimate, which looks at the distance between the estimated and actual values.
Outlines
📊 Understanding R-squared in Regression Analysis
This paragraph introduces the concept of R-squared, a statistical measure that indicates how well a regression line predicts actual values. The explanation begins with the calculation of R-squared, which involves determining the mean of actual values and comparing the distances from these values to the mean with the distances of estimated values from the mean. The presenter illustrates this process by calculating the mean of Y values and using it to derive the actual and estimated values. The distances are squared and summed up to calculate the R-squared value, which in this case is 0.6, indicating a good fit between the actual and estimated values. The importance of R-squared in evaluating the strength of the relationship between variables is emphasized.
🔍 Calculating and Interpreting R-squared Values
The second paragraph delves deeper into the calculation of R-squared, providing a step-by-step breakdown of the process. It starts with squaring the differences between the estimated and actual values from the mean, summing these squared differences to form the numerator of the R-squared formula. The denominator is the sum of squared differences between the actual values and the mean of Y. The resulting R-squared value, 0.6, is then interpreted, with the presenter explaining that values closer to 1 indicate a stronger fit, while values approaching 0 suggest no relationship. The paragraph also briefly mentions the concept of standard error of the estimate as another measure of goodness-of-fit, which will be discussed in a subsequent video.
Mindmap
Keywords
💡R-squared
💡Regression Line
💡Actual Values
💡Mean
💡Estimated Values
💡Distance
💡Squaring
💡Goodness of Fit
💡Standard Error of the Estimate
💡Variance
💡Model Fit
Highlights
R-squared is a measure of how well a regression line predicts or estimates actual values.
Calculating R-squared involves comparing the distances of actual values from the mean to the distances of estimated values from the mean.
The mean of the Y values is used as a reference point in the R-squared calculation.
The sum of the distances of actual values from the mean equals zero, serving as a check for calculations.
Squaring the differences (Y - Y mean) is a step in the R-squared calculation process.
The regression line formula is used to derive estimated values for the R-squared calculation.
The estimated values are plugged into the regression equation to find points on the line.
The distances of estimated values from the mean are calculated and squared for R-squared.
The sum of squared distances of estimated values from the mean is used in the R-squared formula.
R-squared is calculated by dividing the sum of squared distances of estimated values from the mean by the sum of squared distances of actual values from the mean.
An R-squared value of 0.6 indicates a good fit between actual and estimated values.
R-squared approaching 1 signifies a perfect fit, while values close to 0 indicate no relationship.
The tutorial explains the theoretical background and practical steps of calculating R-squared.
The relationship between R-squared and the standard error of the estimate is mentioned as a topic for a future video.
The tutorial provides a step-by-step guide on how to calculate R-squared using a specific dataset.
The importance of comparing actual and estimated values in determining the goodness-of-fit is emphasized.
The tutorial suggests watching other videos in the playlist for a comprehensive understanding of R-squared.
The process of calculating R-squared is visually demonstrated with a regression line and data points.
Transcripts
Browse More Related Video


5.0 / 5 (0 votes)
Thanks for rating: