Parametric surfaces | Multivariable calculus | Khan Academy
TLDRThe video script explores the visualization of a complex two-dimensional input, three-dimensional output function involving trigonometric expressions. It demonstrates evaluating the function at specific points and varying one parameter while holding the other constant, revealing patterns that form circles. The script culminates in the concept of a parametric surface, illustrating how sweeping a circle through space as both parameters vary results in a torus, offering an intuitive understanding of this mathematical shape.
Takeaways
- 📚 The script discusses a complex function with a two-dimensional input and a three-dimensional vector output.
- 📈 The function involves expressions with cosines and sines that depend on the two input coordinates.
- 📝 In the previous video, a method was explained to visualize functions with a single parameter and a two-dimensional vector output.
- 🔍 The script aims to visualize the output space of the function by considering all possible points that could be outputs.
- 👉 The function is evaluated at a simple pair of points, T=0 and S=π, to understand its behavior.
- 🧩 Evaluating the function at T=0 and S=π results in a simplified output that is a point along the x-axis at position 2.
- 🔄 The script suggests visualizing the function by keeping one input constant and varying the other to see the pattern of outputs.
- 🔵 When S is kept constant at π and T varies, the output forms a circle with a radius of two.
- 🔴 Conversely, when T is kept constant at zero and S varies, another circle pattern emerges, but its orientation is different.
- 🍩 If both T and S are allowed to vary freely, the resulting shape is a torus, visualized as one circle sweeping through space as the other varies.
- 🎨 The torus is a parametric surface that can be represented by the given function, illustrating the concept of two-dimensional input and three-dimensional output.
Q & A
What is the nature of the function discussed in the script?
-The function discussed in the script is a two-dimensional input function that produces a three-dimensional vector output, with expressions involving cosines and sines based on the input coordinates.
How does the function simplify when evaluated at T=0 and S=π?
-When evaluated at T=0 and S=π, the function simplifies significantly because cosine(0) and sine(0) are 1 and 0 respectively, and cosine(π) and sine(π) are -1 and 0 respectively, resulting in an output point that is simply two units along the x-axis.
What happens when one of the inputs is held constant while the other varies?
-When one input is held constant, the output forms a circle in the three-dimensional space. For example, if S is held constant at π while T varies, the output forms a circle with a radius of two.
What is the significance of the circle with a radius of two mentioned in the script?
-The circle with a radius of two is the result of holding S constant at π and letting T vary freely. It is significant because it represents a cross-section of the function's output when one variable is fixed.
How does the visualization change if both T and S are allowed to vary freely?
-If both T and S are allowed to vary freely, the visualization results in a torus, or a doughnut shape, as the circle representing the free variation of S sweeps through space while T also varies.
What is a torus and how is it related to the function discussed in the script?
-A torus is a doughnut-shaped surface that results from revolving a circle in three-dimensional space about an axis coplanar with the circle. In the script, the torus is the shape that is formed when both input variables T and S are allowed to vary freely.
What is the role of cosines and sines in the function's output?
-The cosines and sines are used in the expressions that define the three-dimensional vector output of the function. They are trigonometric functions that depend on the input coordinates and are key to the visualization of the function's output.
How does the script suggest visualizing the function's output for a better understanding?
-The script suggests visualizing the function's output by evaluating it at specific points, holding one variable constant while varying the other, and considering the sweeping motion of a circle to form a torus.
Why is the function's output described as a parametric surface?
-The function's output is described as a parametric surface because it is defined by parameters (the input coordinates T and S) that vary over a two-dimensional domain and produce a three-dimensional shape.
What mathematical concept is the script trying to convey through the visualization of the function?
-The script is trying to convey the concept of parametric representation of surfaces in three-dimensional space, specifically how a two-dimensional input can be used to generate a complex three-dimensional shape like a torus.
What is the intuition behind the function's visualization when both T and S are constant?
-When both T and S are constant, the function's visualization results in a single point in three-dimensional space, which is the simplest form of output and serves as a starting point for understanding more complex behaviors when the variables are varied.
Outlines
📚 Visualizing Multi-Dimensional Functions
The script introduces the concept of visualizing a complex function with two-dimensional input and a three-dimensional vector output. The function involves expressions with cosines and sines that depend on the input coordinates. The speaker discusses the previous video's content on visualizing functions with a single input and a two-dimensional vector output, and extends this concept to the three-dimensional case. The function is evaluated at simple points to understand its behavior, such as at T=0 and S=π, resulting in a point along the x-axis. The script also explores the idea of keeping one input constant while varying the other, leading to the visualization of a circle in the output space. This method provides an intuitive understanding of the function's output for different input combinations.
🔄 Exploring Parametric Surfaces and Torus Formation
This paragraph delves into the visualization of parametric surfaces, specifically focusing on how varying one input parameter while keeping the other constant can lead to the formation of a circle in the output space. The speaker encourages the audience to think through the process of why a circle is formed when one parameter is free and the other is held constant. The concept is then extended to visualize what happens when both parameters are allowed to vary freely, which results in a torus shape, commonly referred to as a 'doughnut' shape in mathematics. The script aims to provide an intuitive understanding of parametric surfaces and how they can be used to visualize complex functions with two-dimensional inputs and three-dimensional outputs, setting the stage for a more detailed exploration in a future video.
Mindmap
Keywords
💡Function
💡Two-dimensional input
💡Three-dimensional output
💡Cosines and Sines
💡Visualization
💡Parametric surfaces
💡Torus
💡Circle
💡Variable
💡Trigonometric functions
Highlights
Introduction of a complex function with two-dimensional input and three-dimensional vector output.
Explanation of visualizing functions with a single parameter and a two-dimensional vector output.
Simplification of the function at T=0 and S=π, resulting in a point on the x-axis.
Visualization of the function by plotting points for various input values.
Method to visualize the function by keeping one input constant and varying the other.
Demonstration of how keeping S constant at π and varying T forms a circular pattern.
Clarification of the simplified function when S is constant, resulting in a circle with a radius of two.
Encouragement for the audience to work out the function themselves when T is constant and S varies.
Illustration of the resulting circle when T is held constant and S varies freely.
Concept of sweeping a circle to visualize the three-dimensional shape formed by the function.
Introduction of the torus shape as the result of both T and S varying freely.
Explanation of the torus as a parametric surface visualized by the function.
Promise of a future video detailing the relationship between the function and the torus shape.
Discussion on the intuitive understanding of parametric surfaces with two-dimensional input and three-dimensional output.
The function's role in drawing a torus and its mathematical significance.
Insight into how the function simplifies to form a torus shape in three-dimensional space.
The importance of understanding the relationship between the red and blue circles in the torus visualization.
Transcripts
Browse More Related Video
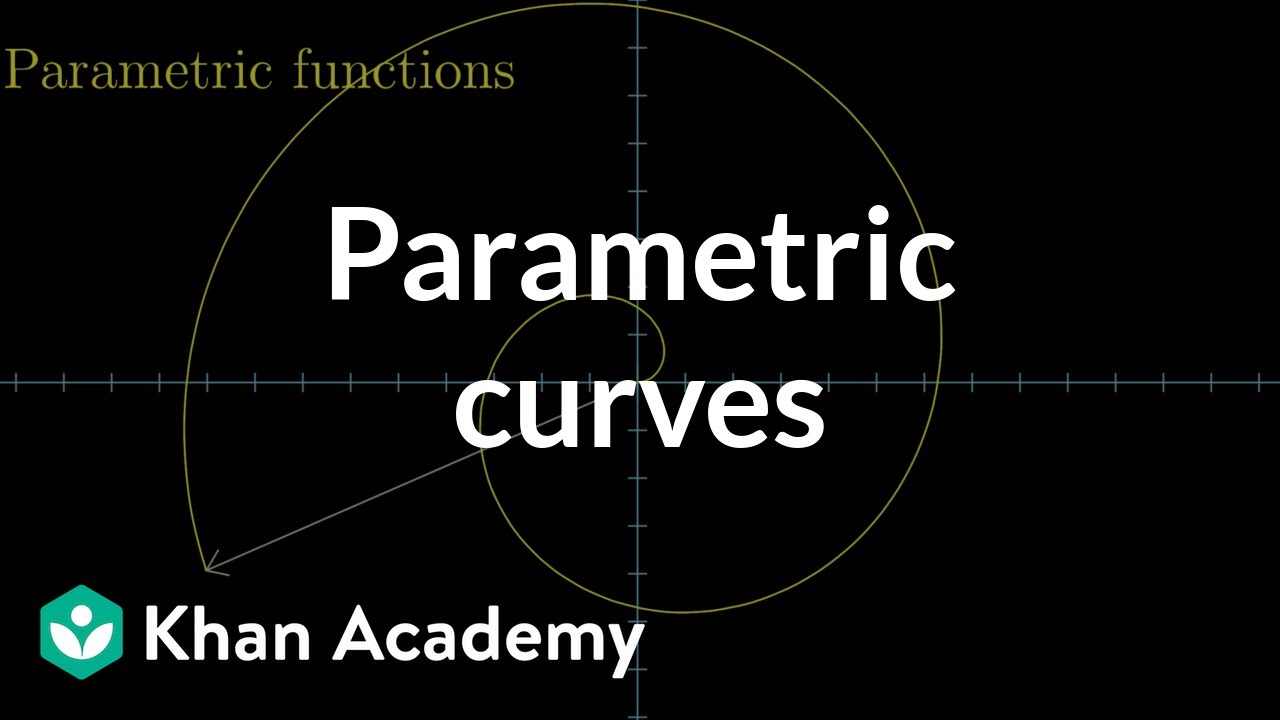
Parametric curves | Multivariable calculus | Khan Academy

Transformations, part 3 | Multivariable calculus | Khan Academy
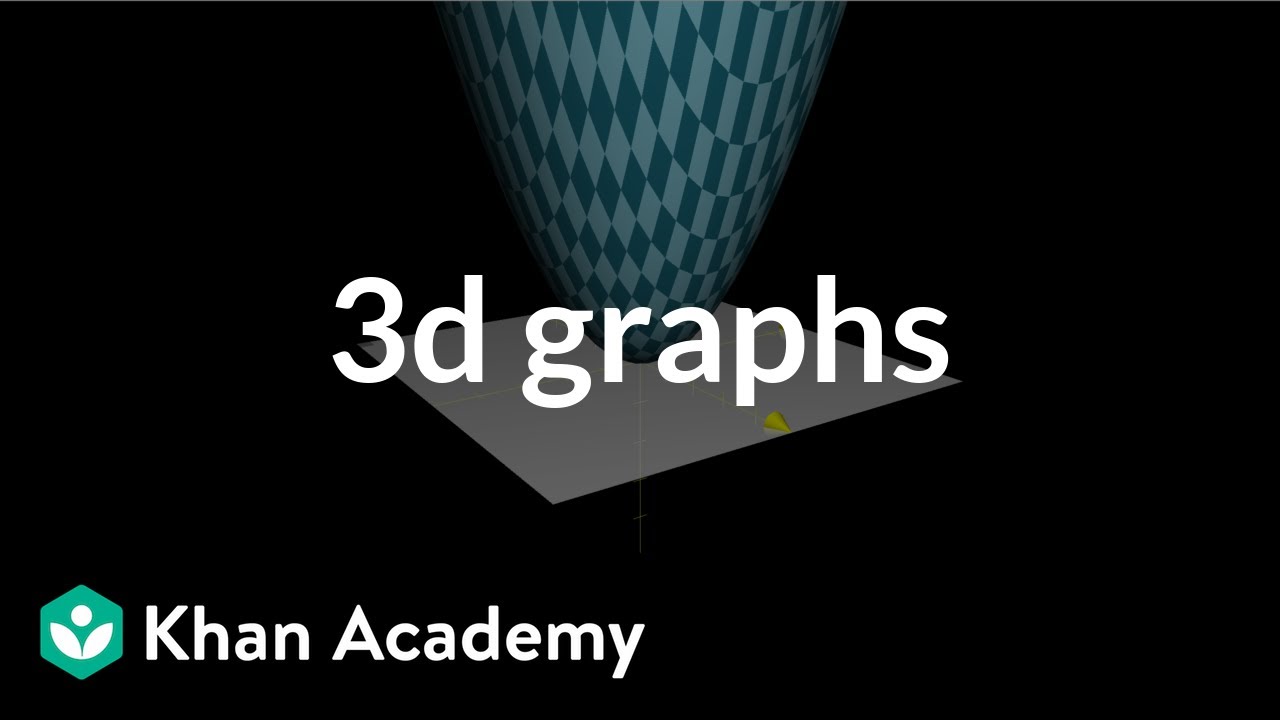
Introduction to 3d graphs | Multivariable calculus | Khan Academy
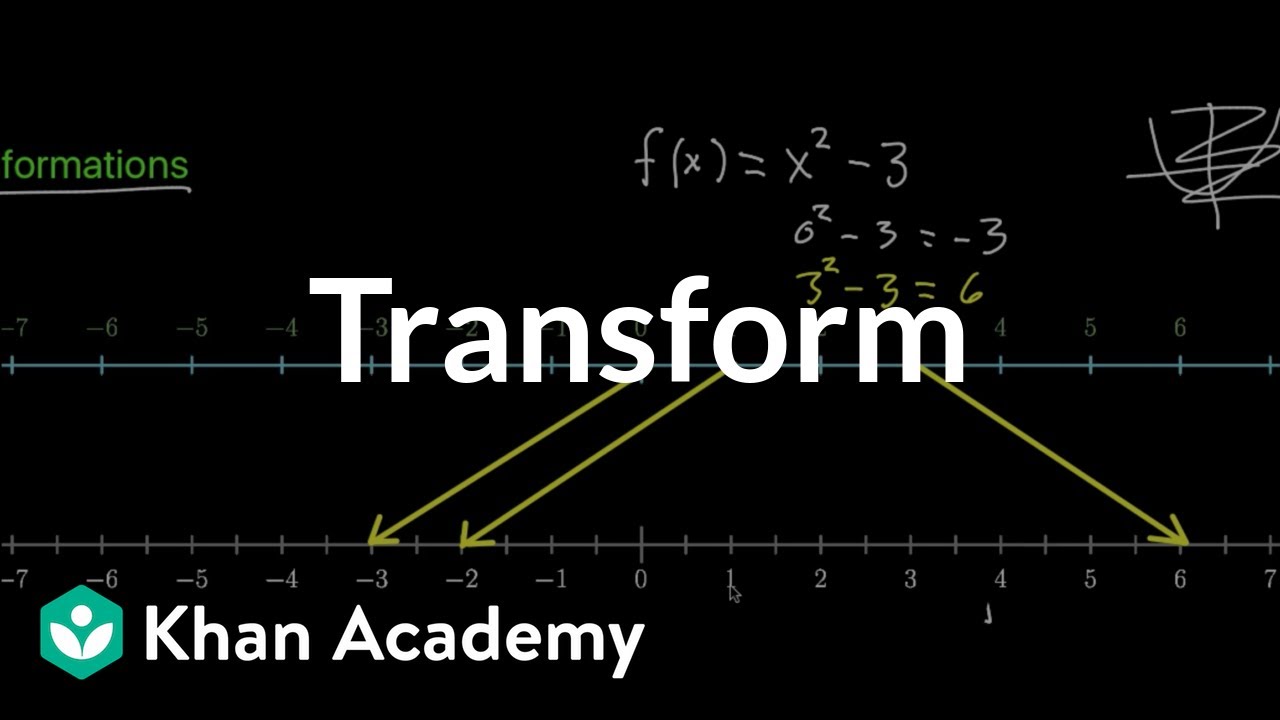
Transformations, part 1 | Multivariable calculus | Khan Academy

Partial derivative of a parametric surface, part 1

Determining a position vector-valued function for a parametrization of two parameters | Khan Academy
5.0 / 5 (0 votes)
Thanks for rating: