Introduction to 3d graphs | Multivariable calculus | Khan Academy
TLDRThis video script explores the concept of three-dimensional graphs as a method to represent multi-variable functions with two inputs and one output. It begins by drawing an analogy with two-dimensional graphs to facilitate understanding, then illustrates how to visualize 3D graphs with the example of f(x, y) = x^2 + y^2. The script discusses the visualization of input-output relationships in 3D space, the formation of surfaces from plotting numerous points, and the effects of modifying the function on the graph's shape. It also cautions against the limitations of visualizing higher-dimensional functions and introduces alternative methods such as contour maps and parametric functions for multi-variable analysis.
Takeaways
- 📈 Three-dimensional graphs represent multi-variable functions with two-dimensional inputs and one-dimensional outputs.
- 📚 Analogous to two-dimensional graphs, three-dimensional graphs help visualize the relationship between inputs and outputs.
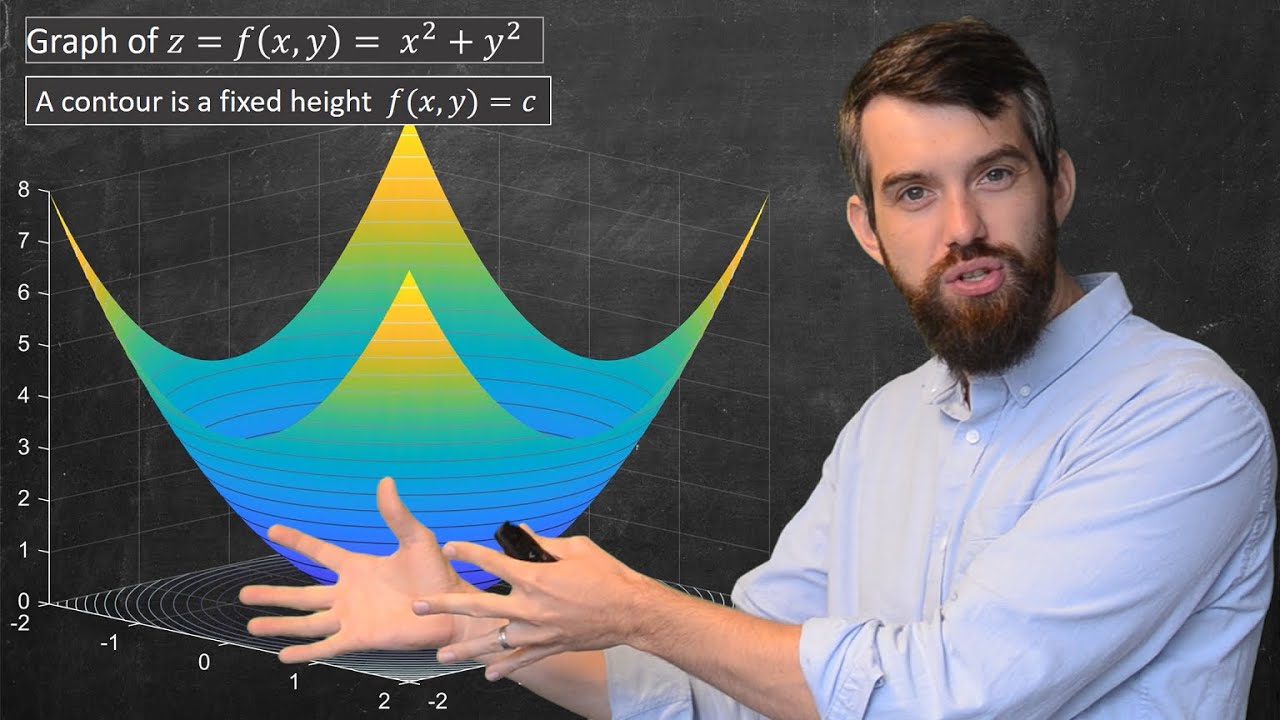
- 👀 The script uses the function f(x, y) = x^2 + y^2 to illustrate the concept of three-dimensional graphing.
- 📊 Two-dimensional graphs are a foundation for understanding three-dimensional graphs, as they both involve plotting input-output pairs.
- 📍 In two dimensions, inputs are plotted on the x-axis, and outputs are represented by the height of the graph.
- 📌 The transition to three dimensions involves considering pairs of points as inputs and plotting them as triplets (x, y, z).
- 🌐 Plotting multiple triplets results in a surface, which can be visualized as a three-dimensional parabola in the given example.
- 🔍 Changing the function, such as multiplying by a fraction, alters the height of the graph, making it steeper or flatter.
- 🚫 The script cautions against trying to visualize every multi-variable function as a three-dimensional graph due to limitations in human spatial visualization.
- 🗺️ It introduces alternative methods for visualizing complex functions, such as contour maps, which look at the input space in a two-dimensional setting.
- 🛰️ The script hints at other visualization techniques like parametric functions and vector spaces that will be covered in subsequent videos.
Q & A
What are three-dimensional graphs used for?
-Three-dimensional graphs are used to represent multi-variable functions that have two-dimensional inputs and one-dimensional output.
How does the function f(x, y) = x^2 + y^2 differ from a two-dimensional graph?
-The function f(x, y) = x^2 + y^2 is a three-dimensional representation of a function that would be a parabola in two dimensions, but in three dimensions, it forms a surface that resembles a three-dimensional parabola.
What is the purpose of plotting points in two-dimensional graphs?
-Plotting points in two-dimensional graphs helps to visualize the relationship between inputs and outputs, showing all possible input-output pairs as a curve on the graph.
How does the height of a point in a three-dimensional graph relate to the function's output?
-In a three-dimensional graph, the height of a point above the xy-plane corresponds to the output value of the function for a given pair of input values.
What happens to the graph of a function when the function is modified to output half of its original value?
-When a function is modified to output half of its original value, the height of every point on the graph is reduced by half, causing the entire graph to 'sloop' downward.
Why is it challenging to visualize multi-variable functions with more than two input dimensions?
-Visualizing multi-variable functions with more than two input dimensions is challenging because it would require a graph with more than three dimensions, which exceeds our ability to easily visualize in a standard three-dimensional space.
What is a contour map and how does it relate to three-dimensional graphs?
-A contour map is a two-dimensional representation of a three-dimensional graph that shows the input space with lines connecting points of equal output value, providing a way to visualize 3-D graphs in a 2-D setting.
What is the significance of the xy-plane in the context of three-dimensional graphs?
-The xy-plane in the context of three-dimensional graphs represents the space where the inputs live, and the outputs are represented by the height above this plane.
How can the shape of a three-dimensional graph be influenced by modifying the function's equation?
-The shape of a three-dimensional graph can be influenced by modifying the function's equation, such as by scaling the output values, which can make the graph 'sloop' up or down, changing its overall form.
What are some alternative methods to visualize multi-variable functions besides three-dimensional graphs?
-Some alternative methods to visualize multi-variable functions include contour maps, parametric functions, and vector space representations, each offering different perspectives on the input and output spaces.
Outlines
📊 Understanding 3D Graphs and Multivariable Functions
This paragraph introduces the concept of three-dimensional graphs as a method to represent multivariable functions with two-dimensional inputs and one-dimensional output. The analogy of two-dimensional graphs is used to explain the visualization process. The function f(x, y) = x² + y² is used as an example to illustrate how points are plotted in three dimensions, forming a surface that resembles a three-dimensional parabola. The importance of understanding the relationship between inputs and outputs is emphasized, and the process of plotting points in 3D space is described, highlighting how it differs from the two-dimensional approach.
🔍 Modifying 3D Graphs and Exploring Different Visualization Techniques
The second paragraph delves into how modifications to the function, such as scaling the output, affect the shape of the 3D graph. It uses the example of changing the function to one-half of x squared plus y squared, which results in the graph's height being reduced by half. The paragraph also cautions against the limitations of visualizing multivariable functions in three dimensions, especially when the input or output dimensions exceed what can be easily represented in a 3D space. It introduces alternative methods of visualization, such as contour maps, parametric functions, and vector spaces, suggesting that there are various ways to understand and represent multivariable functions beyond traditional 3D graphs.
Mindmap
Keywords
💡Three-dimensional graphs
💡Multi-variable function
💡Two-dimensional input
💡One-dimensional output
💡Visualization
💡Input-output pairs
💡xy-plane
💡Surface
💡Contour map
💡Parametric functions
💡Vector space
Highlights
Introduction to three-dimensional graphs as a way to represent multi-variable functions with two-dimensional inputs and one-dimensional output.
Analogous to two-dimensional graphs, three-dimensional graphs help visualize the relationship between inputs and outputs.
The example function f(x, y) = x^2 + y^2 is used to illustrate the concept of three-dimensional graphing.
Explanation of how two-dimensional graphs work by plotting input-output pairs on a graph.
The process of graphing involves plotting points for every possible input-output pair to form a curve.
In three-dimensional space, inputs are thought of as pairs of points, and outputs are the height above the xy-plane.
Visualization of a three-dimensional graph involves plotting triplets (x, y, z) to form a surface.
The shape of the graph for the function f(x, y) = (1/2)(x^2 + y^2) is discussed, showing a modification that reduces the height of the graph.
Further modification by reducing the output to one-twelfth results in a graph very close to the xy-plane, indicating very small outputs.
Caution against the temptation to visualize every multi-variable function as a three-dimensional graph due to limitations in human visualization capabilities.
Introduction to alternative methods for visualizing multi-variable functions beyond three-dimensional graphs.
Mention of contour maps as a two-dimensional representation of three-dimensional data by looking at the input space.
Discussion of parametric functions as a method to visualize output space for multi-variable functions.
Introduction to vector space as another method to look at input space and visualize all possible outputs.
Promise of covering these alternative visualization methods in the next few videos.
Emphasis on the importance of keeping an open mind to different methods for visualizing multi-variable functions.
Transcripts
Browse More Related Video
Visualizing Multi-variable Functions with Contour Plots

Functions of Several Variables!

Transformations, part 2 | Multivariable calculus | Khan Academy
Parametric curves | Multivariable calculus | Khan Academy
Interpreting graphs with slices | Multivariable calculus | Khan Academy
Transformations, part 1 | Multivariable calculus | Khan Academy
5.0 / 5 (0 votes)
Thanks for rating: