Statistics 101: Two-way ANOVA with Replication, Interactions
TLDRThis video in the basic statistics series by Foltz dives into two-way ANOVA with replication, focusing on the analysis of variance involving two factors. It explains the concept through a cotton plant growth experiment, illustrating how to interpret marginal means graphs to identify interactions between factors. Foltz encourages viewers to stay positive, engage with the content, and offers a clear, slow-paced explanation suitable for beginners, complete with examples and graphics.
Takeaways
- 😀 The video is part of a series on basic statistics, focusing on two-way ANOVA with replication.
- 🙌 Encouragement is given to viewers struggling in class, emphasizing the importance of positivity and perseverance.
- 🔗 The speaker invites viewers to follow on various social platforms for updates and to foster community.
- 👍 Viewers are prompted to like, share, and provide feedback on the video to support the creation of more content.
- 📚 The video is tailored for individuals new to statistics, covering basic concepts in a slow and deliberate manner.
- 📈 The script introduces the concept of marginal means graphs, which visualize the effects and interactions of different factors in two-way ANOVA.
- 🤔 An interactive game is used to illustrate how probabilities can change based on multiple influencing factors.
- 📊 The importance of considering interactions between factors is highlighted, using examples from various real-world scenarios.
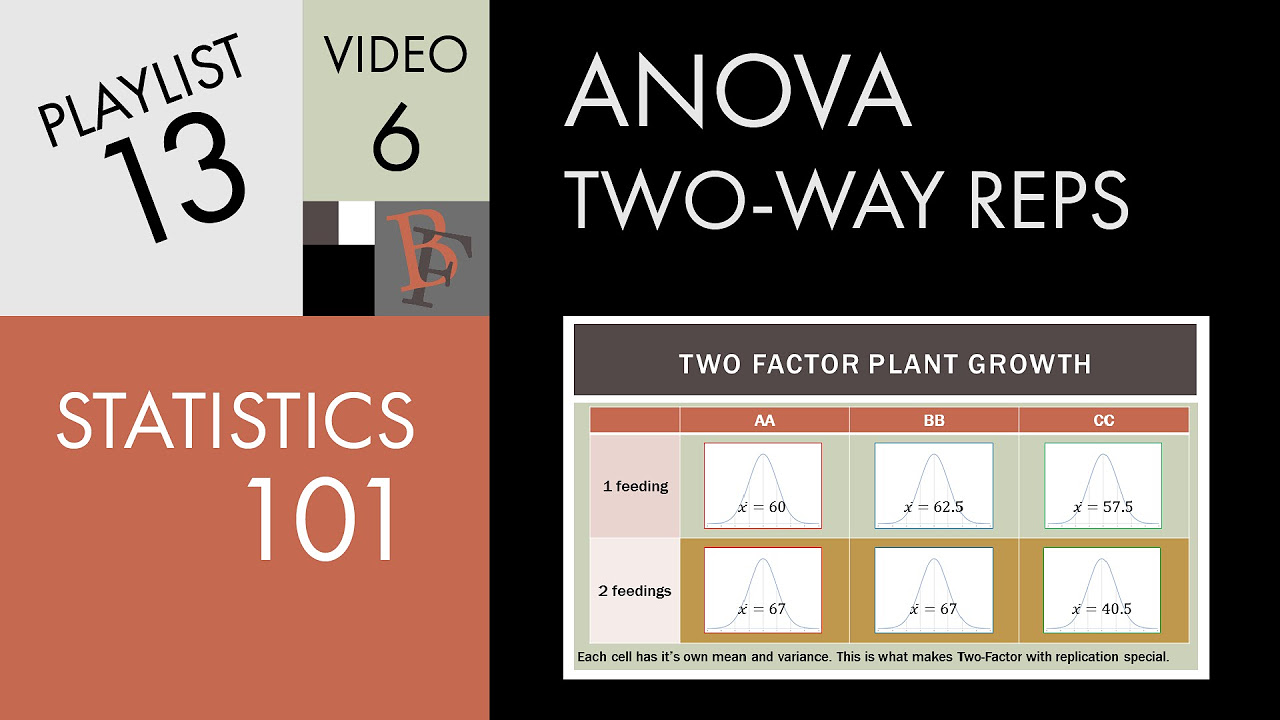
- 🌱 A hypothetical research scenario is presented to demonstrate the application of two-way ANOVA in analyzing the effect of plant food and feeding frequency on cotton plant height.
- 📋 Data from the hypothetical experiment is organized and analyzed, showing the average plant height for different combinations of plant food and feeding frequency.
- 📉 The significance of interactions is discussed, explaining how they indicate that the effect of one factor varies with different levels of another factor.
Q & A
What is the primary topic of this video?
-The primary topic of the video is the analysis of variance (ANOVA), specifically focusing on the two-way ANOVA with replication.
What are some initial points the speaker addresses before delving into the main content?
-The speaker encourages viewers who are struggling to stay positive, invites viewers to follow on social media, asks for feedback and support, and explains that the videos are meant for individuals new to statistics.
What is a two-way ANOVA with replication?
-A two-way ANOVA with replication is a statistical method used to analyze the effect of two factors on a dependent variable, with multiple observations for each combination of factors.
What are marginal means graphs and what purpose do they serve?
-Marginal means graphs, also called interaction graphs, are visual tools used to visualize the characteristics of each factor in an ANOVA and any interaction between them.
How does the speaker illustrate the concept of factoring in information for probability?
-The speaker uses examples such as estimating the probability of a sports team winning a game based on their and their opponent's records and whether the game is at home or away.
What are some examples of interactions mentioned in the video?
-Examples include differences in SAT scores by gender and section, mortgage default rates in different cities by education level, job opportunities in cities by industry, and voting patterns by political party and age group.
What is the example problem used to explain the two-way ANOVA?
-The example involves testing the effectiveness of three different cotton plant foods (AA, BB, CC) with one feeding per day and two feedings per day, measuring the plant heights over 75 days.
How does the speaker explain the concept of interaction using plant food data?
-The speaker explains that different feeding frequencies produce different growth results for different plant foods, showing that the effect of feeding frequency changes across plant food types.
What does the speaker say about the importance of the interaction term in ANOVA?
-The interaction term is crucial because it shows whether the effect of one factor changes at different levels of another factor, and significant interactions are identified using the F-statistic and significance value.
What does the marginal means graph illustrate in the example problem?
-The marginal means graph shows the average plant heights for each combination of plant food and feeding frequency, with the lines crossing indicating an interaction between the factors.
Outlines
📚 Introduction to Basic Statistics Series
The speaker, Foltz, warmly welcomes viewers to a statistics tutorial series, emphasizing positivity and self-belief for those struggling with the subject. He encourages viewers to follow him on various social platforms for updates and to connect with the community. Foltz also invites feedback to improve the content and clarifies that the videos are tailored for beginners, covering fundamental concepts of statistics at a measured pace. The session begins with an introduction to the topic of Analysis of Variance (ANOVA), specifically two-way ANOVA with replication, and the intention to break down the subject into manageable parts, starting with the basics.
📈 Understanding Two-Way ANOVA with Real-World Scenarios
This paragraph delves into the concept of two-way ANOVA, using relatable examples to illustrate the impact of multiple factors on outcomes. It discusses how factors can influence each other, such as a sports team's performance based on various statistics, SAT scores differentiated by gender and section, mortgage default rates in different cities and educational backgrounds, job opportunities in various sectors across cities, and voting patterns in different age groups. The speaker uses these examples to lead into a discussion about interactions between factors, drawing a parallel to drug interactions as a cautionary example of how combining factors can lead to unexpected results.
🌱 Experiment Design and Data Analysis in Two-Way ANOVA
The speaker presents a hypothetical research scenario involving the effectiveness of three different cotton plant foods and their impact on plant height when applied with different feeding frequencies. The experiment design is explained, detailing the replication of the test with eight plants for each combination of plant food and feeding frequency. The collected data is summarized in a table of cell means, highlighting the average height of plants for each treatment combination. The importance of recognizing that these means represent distributions of measurements, not individual data points, is emphasized, setting the stage for understanding how these distributions interrelate in a two-way ANOVA analysis.
📊 Interpreting Marginal Means Graphs and Interaction Effects
The final paragraph focuses on interpreting the marginal means graph generated by SPSS, which visually represents the average plant height for different combinations of plant food and feeding frequency. The speaker guides viewers through analyzing the graph to determine the impact of each factor and their interaction on plant growth. The significance of the interaction is underscored by its presence in the SPSS output, where a low significance value indicates a substantial effect. The paragraph concludes by reinforcing the importance of checking for interaction in ANOVA analysis and understanding how the graphical representation aligns with statistical results.
Mindmap
Keywords
💡Two-way ANOVA
💡Marginal means
💡Interaction
💡SPSS
💡Graph of marginal means
💡Cell means
💡F-statistic
💡Significance value (p-value)
💡Plant food types (AA, BB, CC)
💡Feeding frequency
Highlights
Encouragement for viewers struggling in class to stay positive and believe in their abilities.
Invitation to follow the creator on various social media platforms for updates and connection.
Request for viewers to engage by liking, sharing, and providing feedback on the video.
Introduction of the video's focus on two-way ANOVA with replication, also known as two-factor ANOVA.
Explanation of the video structure, divided into parts to manage the complexity of two-way ANOVA.
Discussion on the importance of visual tools like marginal means graphs in understanding ANOVA.
Illustration of how to construct and interpret marginal means graphs with an example problem.
Introduction of a thought experiment to demonstrate the concept of probability influenced by multiple factors.
Use of sports team example to explain the impact of various factors on the outcome of an event.
Analysis of SAT test performance, highlighting the differences when breaking down scores by gender and section.
Discussion on the factors influencing mortgage default rates, segmented by city and education level.
Exploration of job opportunity disparities between New Delhi and Mumbai across different sectors.
Political voting patterns analysis in South Africa, considering age as a factor for party preference.
Introduction of a hypothetical drug interaction scenario to illustrate the concept of interaction effects.
Presentation of a research problem involving the effectiveness of different cotton plant foods and feeding frequencies.
Description of the experimental design for testing plant growth under various conditions.
Analysis of cell means and the significance of understanding their distribution in two-way ANOVA.
Explanation of how to plot cell means on a graph to visualize the interaction between factors.
Interpretation of the marginal means graph to determine the effect of feeding frequency on plant growth.
Identification of an interaction effect where the impact of feeding frequency varies by plant food type.
Clarification on how to interpret the absence of interaction in a marginal means graph through line positioning.
Review of SPSS output for the two-way ANOVA, emphasizing the significance of the interaction term.
Transcripts
Browse More Related Video
Statistics 101: Two-way ANOVA with Replication, An Introduction
Statistics 101: One-way ANOVA, A Visual Tutorial

Statistics 101: Two-way ANOVA w/o Replication, A Visual Guide
Statistics 101: Two-way ANOVA with Replication, Marginal Means Graphs
Statistics 101: Two-way ANOVA w/o Replication, The Calculation
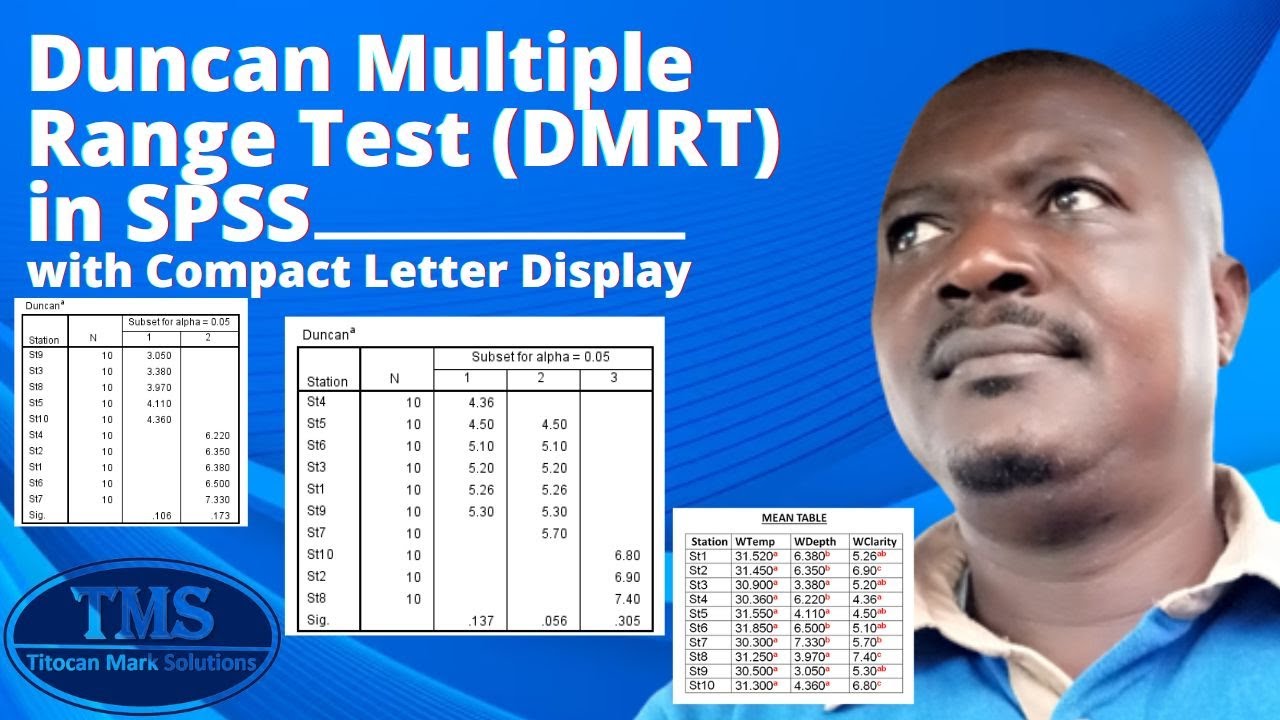
Duncan Multiple Range Test (DMRT) with Compact Letter Display
5.0 / 5 (0 votes)
Thanks for rating: