Probability Distributions Made Easy: Top 3 to Know for Data Science Interviews
TLDRIn this informative video, Emma highlights the three most common probability distributions in data science interviews: the normal, binomial, and geometric distributions. She explains the central limit theorem's role in the prevalence of the normal distribution and its use in modeling continuous data. The binomial distribution is discussed for discrete data, with applications in click-through rates and other binary outcomes. The geometric distribution is introduced for calculating customer lifetime based on churn rates, offering practical insights into these essential statistical tools.
Takeaways
- 📊 The normal distribution, also known as the Gaussian distribution, is the most common distribution in data science interviews due to the central limit theorem, which states that the sampling distribution of the means will be normally distributed regardless of the underlying population distribution.
- 📈 The normal distribution is characterized by its mean and standard deviation, which determine the shape of the bell curve, and is used to model continuous data.
- 🔍 The central limit theorem is crucial as it allows for the modeling of sample means and sums with a normal distribution, even when the original population distribution is unknown or skewed.
- 🕊 An example of the normal distribution in practice is estimating the average time spent by users on a website through repeated sampling and averaging.
- 📚 The binomial distribution is used for discrete data and is defined by the probability of success (p) and the number of trials, often used to measure the total number of successes in binary outcomes.
- 🎲 The binomial distribution can be applied to real-world scenarios such as calculating click-through rates for advertisements, where success is defined as a click.
- 🔄 The negative binomial distribution represents the number of successes before a specific number of failures occur, which is related to the binomial distribution but focuses on the count before a failure.
- 📝 The geometric distribution is a special case of the negative binomial distribution that calculates the number of trials needed to achieve the first success, often used to determine customer lifetime in business contexts.
- 💡 Understanding the geometric distribution allows data scientists to calculate the average customer lifetime given a constant churn rate, using the formula which is the reciprocal of the churn rate.
- 📘 These three distributions—the normal, binomial, and geometric—are not only commonly discussed in data science interviews but are also frequently applied in practical scenarios.
- 🔑 The video aims to provide a refresher on these probability distributions and possibly introduce new insights to viewers, emphasizing their importance in both interviews and real-world applications.
Q & A
What are the top three probability distributions commonly discussed in data science interviews according to the video?
-The top three probability distributions discussed in the video are the normal distribution, the binomial distribution, and the geometric distribution.
Why is the normal distribution often referred to as a 'bell curve'?
-The normal distribution is often referred to as a 'bell curve' because of its symmetrical shape that resembles a bell, which is a result of its mathematical properties.
What is the central limit theorem and how does it relate to the normal distribution?
-The central limit theorem states that the sampling distribution of the means will follow a normal distribution regardless of the underlying distribution of the population, provided that the sample size is sufficiently large. This is why the normal distribution is so widely used in data science.
What determines the shape of the normal distribution?
-The shape of the normal distribution is determined by its mean and standard deviation. The mean is the highest point of the distribution, and the standard deviation measures the amount of variability or dispersion of the values.
Can you provide an example of how the normal distribution is applied in real life?
-An example given in the video is estimating the average time spent per user per day on a website. By repeatedly selecting random samples of users and calculating their average time spent, the distribution of these averages will follow a normal distribution due to the central limit theorem.
What is the binomial distribution and what kind of data does it model?
-The binomial distribution is for discrete data and models the number of successes in a fixed number of independent trials, where each trial has the same probability of success. It is used when the outcome of interest has a binary nature.
What does 'success' mean in the context of the binomial distribution?
-'Success' in the context of the binomial distribution refers to the occurrence of the outcome of interest, which is defined based on the specific scenario and can be any binary outcome such as clicking or not clicking on an advertisement.
How is the geometric distribution different from the negative binomial distribution?
-The geometric distribution represents the number of trials needed to get the first success, while the negative binomial distribution represents the number of successes before a specific number of failures occur. The geometric distribution is a special case of the negative binomial distribution where only the first success is counted.
What is the relationship between the monthly churn rate and the average customer lifetime according to the geometric distribution?
-The average customer lifetime can be calculated using the geometric distribution by taking the reciprocal of the monthly churn rate (1/c), where 'c' is the probability of a customer churning in a given month.
Why is the geometric distribution useful for calculating customer lifetime?
-The geometric distribution is useful for calculating customer lifetime because it models the number of trials (in this case, months) until the first success (churning) occurs, allowing us to estimate the average duration a customer remains with a service.
How can the video's discussion on probability distributions benefit someone preparing for a data science interview?
-The discussion on probability distributions in the video can benefit someone preparing for a data science interview by providing a refresher on key concepts, offering insights into real-life applications, and potentially introducing new ways to approach common interview questions related to these distributions.
Outlines
📊 Introduction to Common Probability Distributions in Data Science
Emma introduces the video, stating that it will cover the top three probability distributions commonly encountered in data science interviews: the normal distribution, binomial distribution, and geometric distribution. She emphasizes that these distributions are crucial for data science professionals and promises to provide real-life applications and examples for each.
🔔 Understanding the Normal Distribution
Emma explains the normal distribution, also known as the Gaussian distribution, highlighting its bell-shaped curve. She discusses the central limit theorem, which states that the sampling distribution of the means will follow a normal distribution regardless of the population distribution. This makes the normal distribution essential for modeling sampling distributions. She provides an example of estimating average time spent on a website and explains how the central limit theorem applies to both averages and sums of samples.
🪙 Exploring the Binomial Distribution
Emma delves into the binomial distribution, a discrete distribution used for binary outcomes. She explains that the distribution is characterized by the probability of success (p) and the total number of trials (n). She provides practical examples, such as calculating click-through rates for advertisements and measuring purchase rates, to illustrate the application of the binomial distribution in real-world scenarios.
📈 Introduction to the Geometric and Negative Binomial Distributions
Emma introduces the geometric distribution and its relation to the negative binomial distribution. She explains that the negative binomial distribution measures the number of successes before a specified number of failures, while the geometric distribution specifically focuses on the number of trials needed to achieve the first success. She provides an example of calculating customer lifetime given a constant monthly churn rate, explaining how to use the geometric distribution to find the average customer lifetime.
📚 Summary of Key Distributions in Data Science
Emma recaps the three key distributions discussed: the normal distribution, binomial distribution, and geometric distribution. She emphasizes their importance in data science interviews and practical applications. She encourages viewers to subscribe to her channel for more content and concludes the video.
Mindmap
Keywords
💡Data Science
💡Probability Distributions
💡Normal Distribution
💡Binomial Distribution
💡Geometric Distribution
💡Central Limit Theorem
💡Mean
💡Standard Deviation
💡Success Rate
💡Customer Lifetime
💡Churn Rate
Highlights
The video discusses the top three probability distributions commonly used in data science interviews: the normal, binomial, and geometric distributions.
The normal distribution, also known as the Gaussian distribution, is the most common for continuous data due to the central limit theorem.
The central limit theorem states that the sampling distribution of the means will be normally distributed regardless of the underlying population distribution.
A minimum of 30 samples is recommended for the central limit theorem to be accurate, with a larger sample size needed for skewed populations.
The normal distribution is characterized by its mean and standard deviation, which allows for selecting the most appropriate curve from the collection.
An example of the normal distribution is estimating the average time spent by users on a website and observing the distribution of these averages.
The total time spent by all users per day also follows a normal distribution, as explained by the central limit theorem for sums.
Most real-world raw data is often long-tailed and not perfectly normal, with examples like time spent on social media.
The binomial distribution is for discrete data and is determined by the probability of success and the number of trials.
Success in a binomial distribution is defined as obtaining the outcome of interest with a binary outcome.
An example of a binomial distribution is calculating the click-through rate of an advertisement, which follows a binomial distribution.
The click-through rate itself follows a Bernoulli distribution, which is a normalized form of the binomial distribution.
The geometric distribution is related to the negative binomial distribution and represents the number of trials needed to achieve the first success.
The geometric distribution is used to calculate customer lifetime, given a constant monthly churn rate.
The average customer lifetime can be calculated using the expectation of a geometric distribution, which is 1 over the churn rate.
The video aims to provide a refresher on probability distributions and introduce practical applications for data science interviews.
The video concludes with a summary of the three discussed distributions and their importance in both interviews and real-world applications.
Transcripts
Browse More Related Video

Python for Data Analysis: Probability Distributions
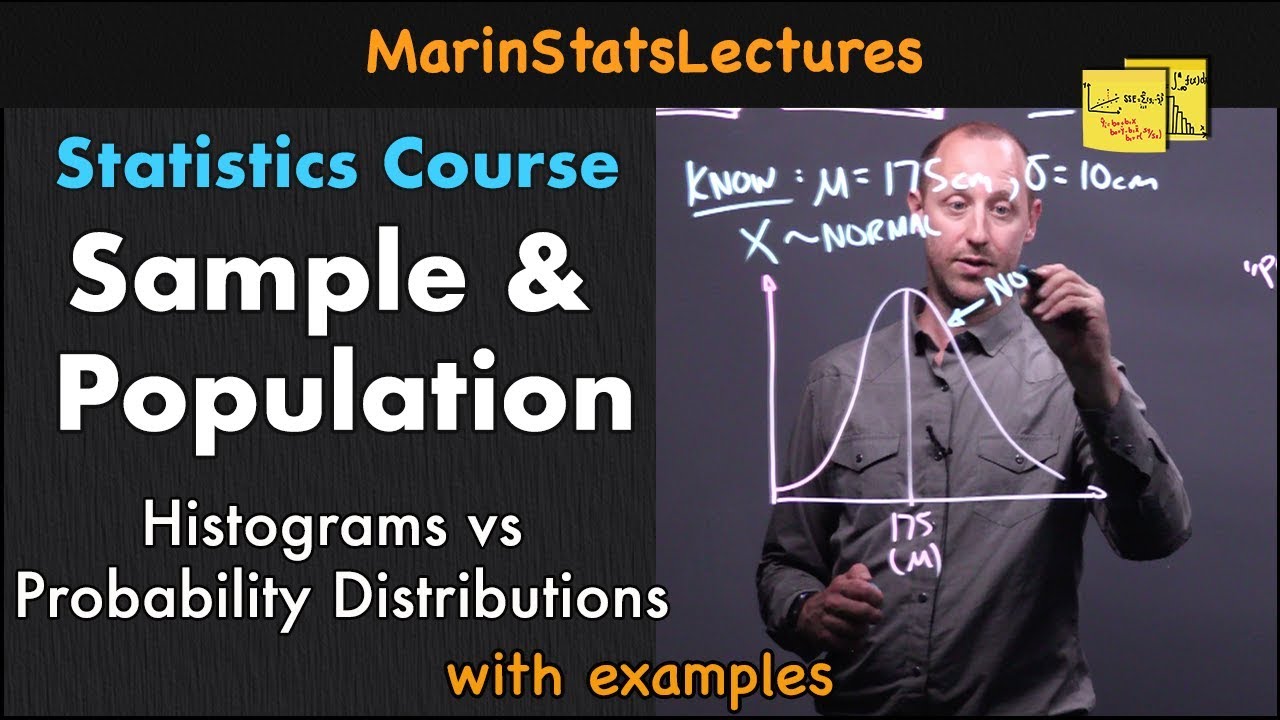
Sample and Population in Statistics | Statistics Tutorial | MarinStatsLectures
Types Of Distribution In Statistics | Probability Distribution Explained | Statistics | Simplilearn

Probability: Types of Distributions

Visualizing a binomial distribution | Probability and Statistics | Khan Academy

Ultimate Probability Review for AP Statistics to Score a 5
5.0 / 5 (0 votes)
Thanks for rating: