Ultimate Probability Review for AP Statistics to Score a 5
TLDRThis comprehensive guide delves into the complexities of probability for AP Statistics, covering essential concepts such as basic probability, conditional probability, and distributions like binomial, geometric, and normal. The instructor provides clear examples and formulas, emphasizing the importance of understanding independence and mutual exclusivity in calculating probabilities. The video also explores discrete and continuous random variables, highlighting the use of calculators for complex problems and the significance of probability in various statistical topics.
Takeaways
- 📚 Probability is a critical topic for the AP Statistics exam, intertwining with almost every subject area.
- 🔢 Basic probability involves calculating the likelihood of single or multiple events, with key formulas provided on the AP Stats formula sheet.
- ❌ Mutually exclusive events cannot occur simultaneously, simplifying calculations where the probability of their intersection is zero.
- 🔄 Independent events occur without affecting each other's probability, leading to straightforward multiplication for joint probabilities.
- 🌐 Conditional probability is calculated by considering the probability of an event given another event has occurred, using a specific formula.
- 📊 Two-way tables and tree diagrams are useful tools for visualizing and calculating probabilities in complex scenarios.
- 🎲 Random variables can be discrete or continuous, with different rules and calculations applying to each, including mean and standard deviation.
- 📘 Discrete random variables are whole numbers and can be modeled using probability distributions, such as binomial and geometric distributions.
- 📊 The binomial distribution is used for a fixed number of trials with a constant probability of success, while the geometric distribution focuses on the number of trials until the first success.
- 📊 Continuous random variables, like those in a normal distribution, have an infinite number of possible outcomes and are described by mean and standard deviation.
- 🧩 Sampling distributions are normal under certain conditions and are used to estimate population parameters, with specific formulas for proportions, means, and differences between means or proportions.
Q & A
What is the main topic discussed in the video script?
-The main topic discussed in the video script is the various types of probability in the context of AP Statistics, including basic probability, conditional probabilities, probabilities with random variables, binomial and geometric distributions, normal distribution, and probability from sampling distributions.
What is the formula for calculating the probability of two events A or B occurring?
-The formula for calculating the probability of two events A or B occurring is P(A or B) = P(A) + P(B) - P(A and B), where P(A and B) is the probability of both events happening together.
What does it mean for two events to be mutually exclusive?
-Two events are mutually exclusive if they cannot happen at the same time. In this case, the probability of both events occurring together, P(A and B), is zero.
What is the definition of independent events?
-Independent events are events where the occurrence of one event does not impact the probability of the second event. If events A and B are independent, then P(A and B) = P(A) * P(B).
How can you determine if two events are independent using the given probabilities of A and B?
-You can determine if two events are independent by multiplying the probabilities of the individual events (P(A) * P(B)) and checking if the result equals the probability of both events occurring together (P(A and B)). If they are equal, the events are independent.
What is a two-way table and how can it be used to calculate probabilities?
-A two-way table is a statistical tool that displays the frequency of outcomes for two categorical variables. It can be used to calculate probabilities by dividing the frequency of a specific outcome or combination of outcomes by the total number of observations.
What is conditional probability and how is it calculated?
-Conditional probability is the probability of an event A occurring, given that event B has already occurred. It is calculated using the formula P(A|B) = P(A and B) / P(B), where P(A and B) is the probability of both A and B happening, and P(B) is the probability of B happening alone.
What is a tree diagram and how can it be used in probability?
-A tree diagram is a graphical representation of different outcomes and their probabilities. It can be used in probability to visualize the steps leading to an event and to calculate the probability of that event by multiplying the probabilities along the branches leading to it.
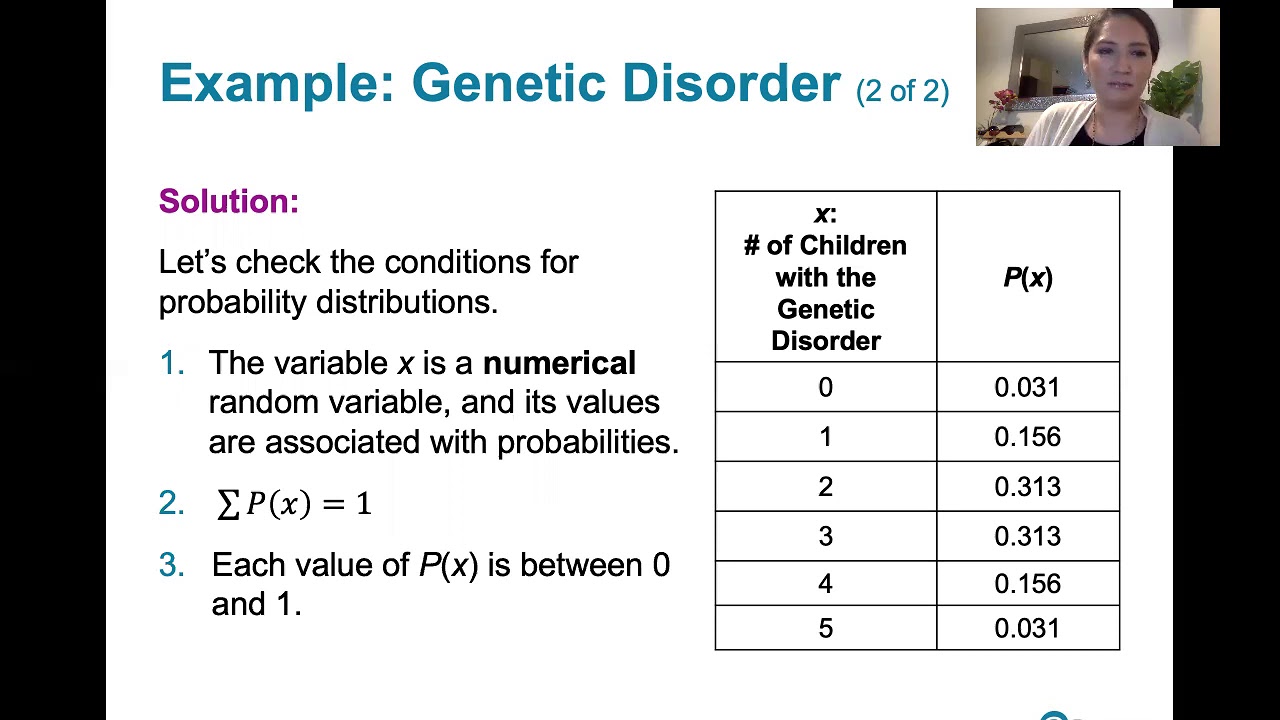
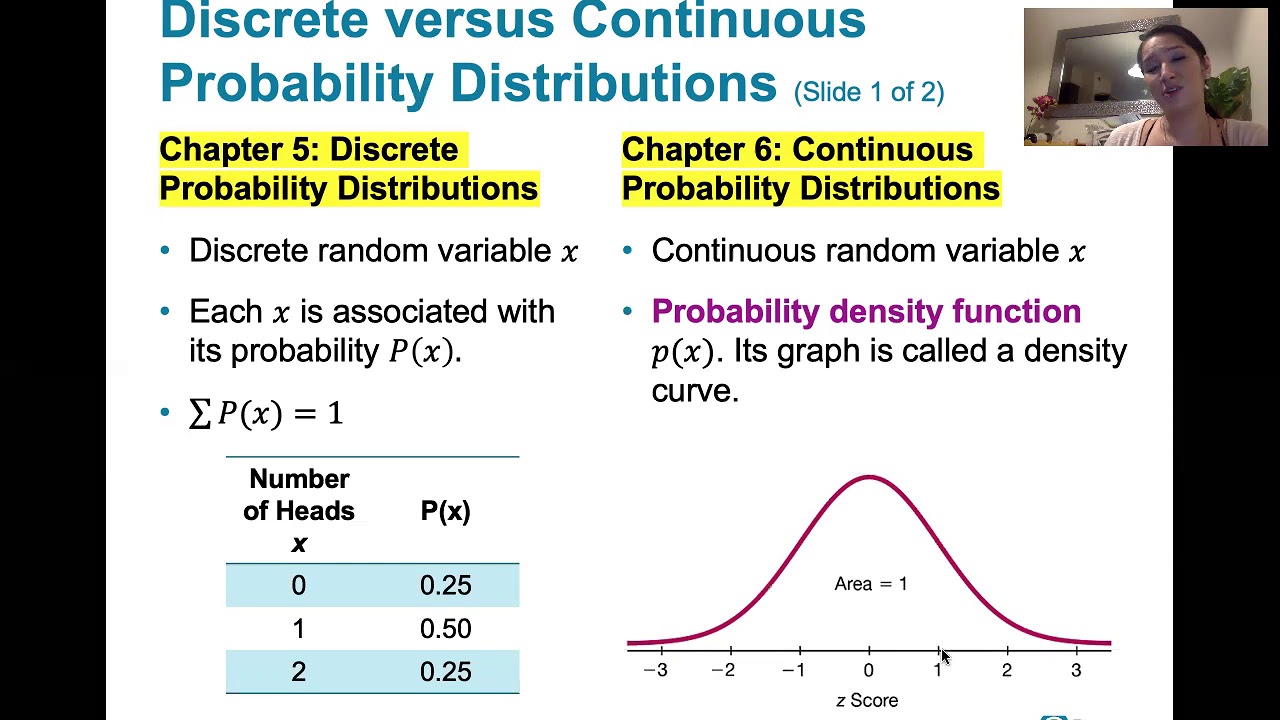
What is a discrete random variable and how does it differ from a continuous random variable?
-A discrete random variable is one that can take on a countable number of distinct values, often whole numbers. It differs from a continuous random variable, which can take on any value within a range, including decimal values, and is typically represented by distributions like the normal distribution.
What is the mean and standard deviation of a discrete probability model, and how are they calculated?
-The mean (expected value) of a discrete probability model is calculated by summing the product of each outcome and its probability. The standard deviation is a measure of the dispersion of the outcomes around the mean and is calculated by summing the squared differences between each outcome and the mean, multiplied by their probabilities, and then taking the square root of the result.
Can you explain the concept of a binomial distribution and its application?
-A binomial distribution is a discrete probability distribution that describes the number of successes in a fixed number of independent Bernoulli trials with the same probability of success. It is used in scenarios where you want to predict the number of successes in a given number of trials, such as the number of successful shots in a set of basketball free throws.
What is the geometric distribution and how is it used in probability?
-The geometric distribution is a discrete probability distribution that describes the number of trials required for the first success in a sequence of Bernoulli trials. It is used to model the number of attempts it takes to achieve the first success, such as the number of darts thrown to hit a target for the first time.
How are normal distribution probabilities calculated and what are z-scores used for?
-Normal distribution probabilities are calculated using the mean and standard deviation of the distribution. Z-scores are used to standardize the distribution and compare individual data points to the mean, indicating how many standard deviations an element is from the mean. They are used in conjunction with normalcdf or Z tables to find probabilities.
What are sampling distributions and how are they used in statistical analysis?
-Sampling distributions are probability distributions of a given statistic based on a random sample. They are used in statistical analysis to make inferences about a population from sample data. The video script discusses sampling distributions for proportions, differences between proportions, sample means, and differences between sample means.
Why is it important to understand the conditions for a sampling distribution to be considered normal?
-It is important to understand the conditions for a sampling distribution to be considered normal because many statistical tests and confidence intervals assume normality. Conditions such as having a sample size of 30 or more, or having a sample from a normally distributed population, can ensure that the sampling distribution is approximately normal, allowing the use of z-scores and normal probability tables.
Outlines
📚 Introduction to AP Statistics Probability
This paragraph introduces the complexity and importance of probability in AP Statistics. It outlines the various types of probability that will be discussed, including basic probability, conditional probabilities, probabilities involving random variables, binomial and geometric distributions, normal distribution, and probabilities derived from sampling distributions which yield p-values. The speaker emphasizes the necessity to understand these concepts due to their pervasiveness in the AP exam and provides a brief overview of what will be covered in the video, including examples and explanations of different probability scenarios.
🔍 Delving into Basic Probability Concepts
The speaker explains the fundamental principles of basic probability, such as the probability of mutually exclusive events and independent events. The key formula for calculating the probability of two events occurring together or separately is introduced, and the distinction between mutually exclusive and independent events is clarified. Examples are provided to illustrate how to calculate the probability of events like tornadoes or earthquakes occurring, and the concept of double counting is discussed in the context of two-way tables.
🎯 Conditional Probability and Tree Diagrams
This section delves into conditional probability, which is the probability of an event occurring given that another event has already occurred. The formula for conditional probability is presented, and the importance of the order of events in the condition is highlighted. The use of tree diagrams as a tool for visualizing and calculating conditional probabilities is introduced, with an example involving disease testing and its accuracy rates to demonstrate how to apply the concept.
📊 Discrete Random Variables and Probability Models
The speaker discusses discrete random variables, where outcomes are numerical and typically whole numbers. The concept of a discrete probability model is introduced, using the example of a soccer player scoring goals. The speaker explains how to calculate the mean and standard deviation for discrete random variables, using the provided data to illustrate the process. The idea of long-term expected outcomes is explored, and the use of technology, such as calculators, to simplify these calculations is highlighted.
🎲 Binomial Distribution and Its Applications
The paragraph focuses on the binomial distribution, a type of discrete random variable that involves a fixed number of trials with a constant probability of success. The formula for calculating binomial probabilities is presented, along with an example of a dart player throwing darts at a target. The speaker demonstrates how to calculate the probability of exactly two successful hits out of eight attempts and the probability of hitting at least three targets, using both the binomial PDF and CDF functions on a calculator.
🏹 Geometric Distribution and Calculating Successes
This section introduces the geometric distribution, which is concerned with the number of trials it takes to achieve the first success. The formula for calculating probabilities in the geometric distribution is explained, using the dart player example to illustrate how to find the probability of achieving the first hit on the fifth throw. The speaker also discusses how to calculate the probability of the first success occurring after a certain number of trials, emphasizing the simplicity of these calculations.
📐 Understanding the Normal Distribution
The speaker explains the normal distribution, which is a continuous random variable model used when outcomes can be any number within a range. The normal distribution is characterized by its mean and standard deviation. An example involving ice cream containers filled to a mean weight is used to demonstrate how to calculate the probability of a container weighing less than a certain amount using z-scores and normalcdf functions on a calculator.
🧩 Combining Normal Distributions for Complex Problems
This paragraph discusses how to handle problems involving the combination of normal distributions, such as calculating the total weight of a crate filled with ice cream containers. The speaker explains the rules for combining variances and converting them back into standard deviations to find the overall distribution for the combined variables. An example is provided to calculate the probability of a crate weighing more than a specified amount, illustrating the process of finding the z-score and using it with the normalcdf function.
📊 Sampling Distributions and Their Significance
The final paragraph covers sampling distributions, which are used to estimate population parameters. The speaker explains the conditions under which sampling distributions for proportions and means become normal, allowing the use of the normal model for probability calculations. Formulas for the mean and standard deviation of sampling distributions are provided, and the importance of having a sufficient sample size or a normally distributed population is emphasized. The speaker assures that understanding these concepts will enable students to tackle probability questions involving sampling distributions on the AP exam.
🎓 Conclusion and Emphasis on Probability's Role in AP Exam
In conclusion, the speaker reiterates the pervasiveness of probability throughout the AP Statistics exam and encourages students to thoroughly understand the concepts covered in the video. The importance of probability in various statistical topics is highlighted once more, and the speaker expresses hope that the video has been helpful for exam preparation.
Mindmap
Keywords
💡Probability
💡Mutually Exclusive Events
💡Independent Events
💡Conditional Probability
💡Binomial Distribution
💡Geometric Distribution
💡Normal Distribution
💡Random Variables
💡Sampling Distributions
💡Z-Score
💡AP Statistics Exam
Highlights
Probability is a crucial topic in AP Statistics, intertwining with almost every subject area.
Different types of probability include basic probability, conditional probabilities, and probabilities involving random variables, binomial, geometric, and normal distributions, as well as sampling distributions.
The formula for calculating the probability of two events A or B is P(A or B) = P(A) + P(B) - P(A and B), which is essential for understanding mutual exclusivity and independence.
Mutually exclusive events cannot occur simultaneously, making the probability of their intersection zero.
Independent events have probabilities that do not affect each other, leading to P(A and B) = P(A) * P(B).
An example demonstrates calculating the probability of a tornado or an earthquake using the formula for two events.
Checking for independence involves multiplying the probabilities of individual events and comparing them to the joint probability.
Two-way tables are useful for probability questions involving categorical variables like gender and satisfaction.
Conditional probability is calculated as P(A given B) and is handled with tree diagrams for clarity.
A medical testing scenario illustrates the concept of conditional probability and the importance of distinguishing between independent and dependent events.
Random variables, either discrete or continuous, bring numerical outcomes into probability calculations, with different rules applying to each type.
Discrete probability models are used for whole number outcomes, and their mean and standard deviation can be calculated using specific formulas.
Binomial distribution is a type of discrete random variable that follows a specific formula for calculating the probability of a given number of successes in a fixed number of trials.
The geometric distribution, another discrete random variable, is used to find the probability of a first success occurring on a given trial or later.
Normal distribution is used for continuous random variables and involves z-scores and normalcdf for probability calculations.
Sampling distributions are normal models used for proportions, sample means, and differences between sample means or proportions, with specific formulas provided for mean and standard deviation.
The video concludes by emphasizing the importance of understanding the normal model for probability questions on the AP exam.
Transcripts
Browse More Related Video
02 - Random Variables and Discrete Probability Distributions
2022 Live Review 2 | AP Statistics | Making Sense of Probability & Random Variables
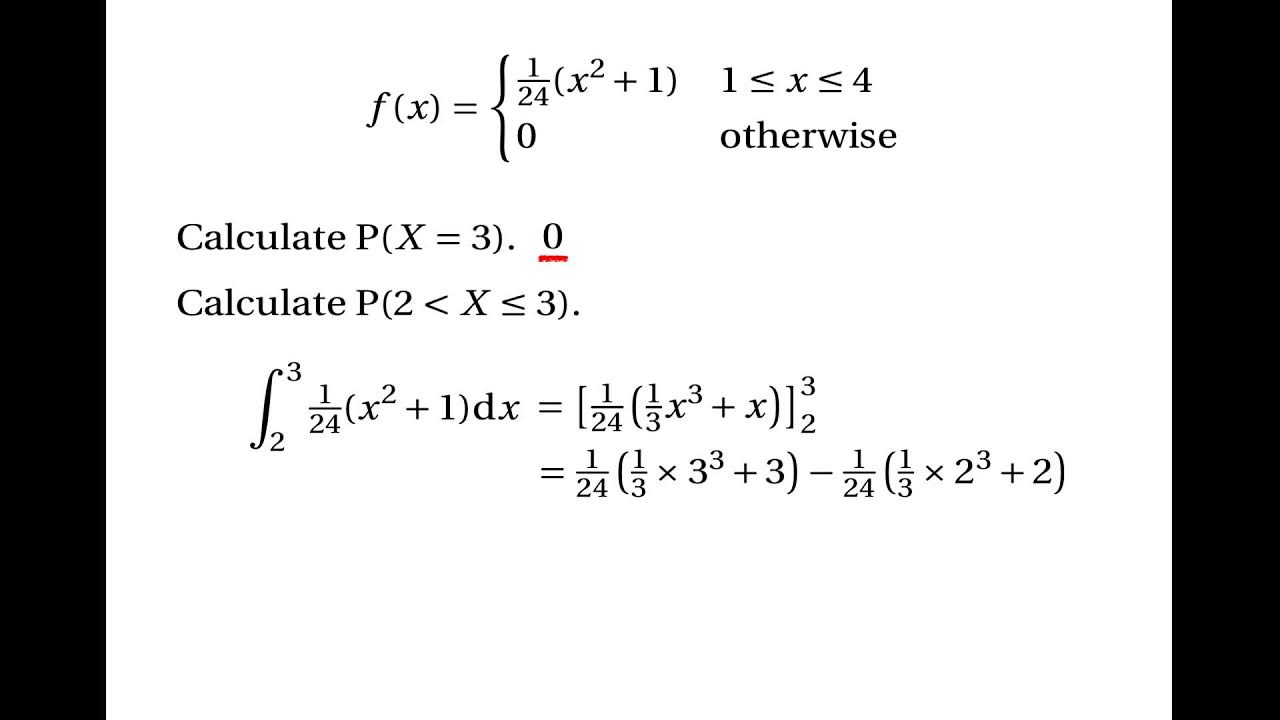
Continuous Random Variables: Probability Density Functions
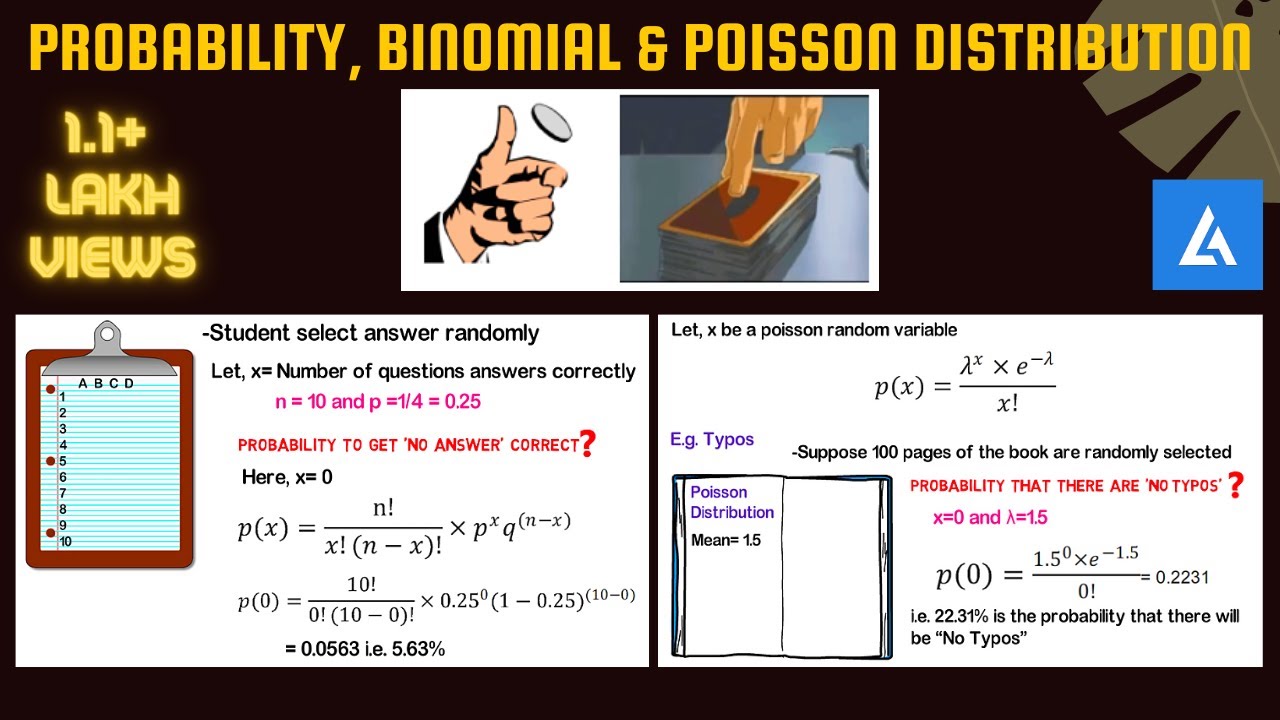
Basics of Probability, Binomial and Poisson Distribution
5.1.2 Discrete Probability Distributions - Probability Distributions and Probability Histograms
6.1.1 The Standard Normal Distribution - Discrete and Continuous Probability Distributions
5.0 / 5 (0 votes)
Thanks for rating: