Math 119 Chap 8 part 2
TLDRThe video script is a detailed instructional guide on hypothesis testing in statistics, focusing on chapters eight and nine. It covers testing claims about population proportions, means, and standard deviations using both calculators and manual calculations. The instructor demonstrates step-by-step processes, including setting up null and alternate hypotheses, determining test criteria, calculating test statistics, and interpreting p-values to make conclusions about the validity of claims. The script emphasizes the importance of understanding the concepts behind the calculations, not just relying on technology.
Takeaways
- 📚 The instructor is covering Chapter 8 of a statistics course, focusing on hypothesis testing, particularly for proportions and means.
- 🔢 The class is learning to use a calculator to assist with hypothesis testing, specifically for test statistics and p-values.
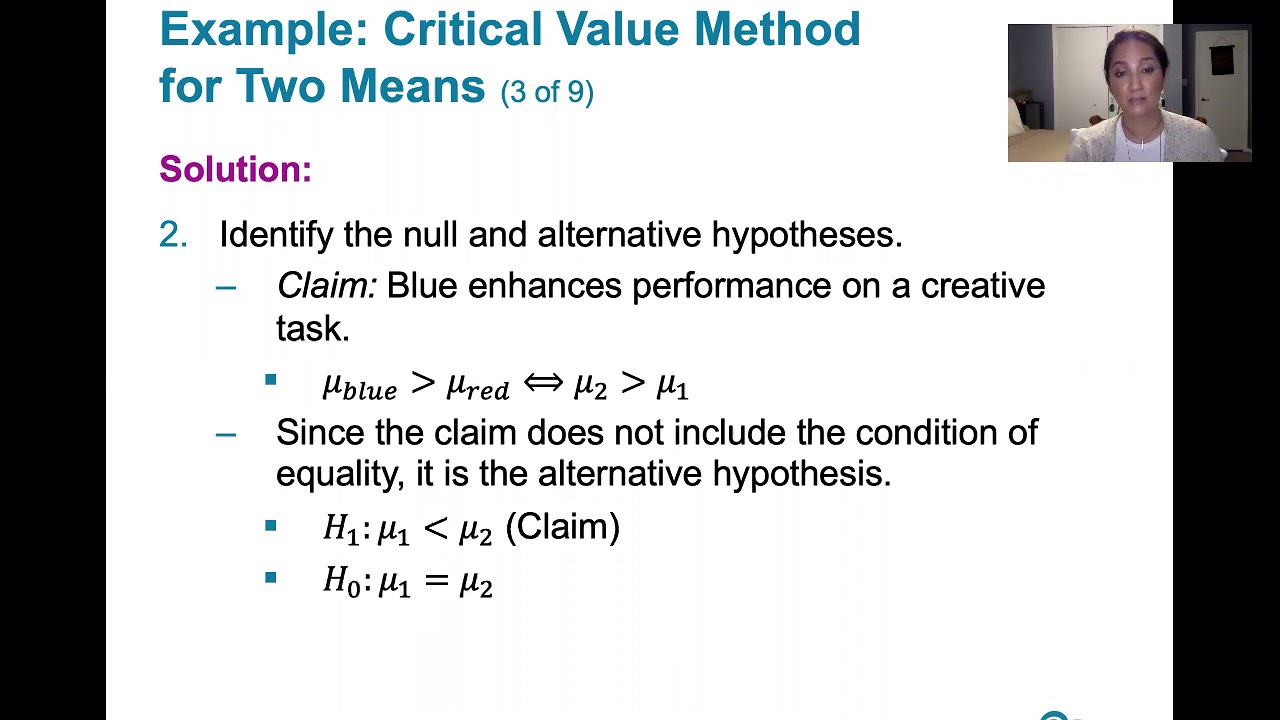
- 📉 The script explains the process of setting up null and alternative hypotheses, emphasizing the importance of identifying the correct claim and its opposite.
- 📌 The video demonstrates how to identify the type of tail test (left-tailed, right-tailed, or two-tailed) based on the alternative hypothesis.
- 🎯 The instructor shows step-by-step calculations for test statistics using both manual methods and calculator functions, such as '1 prop Z test' for proportions.
- 🧩 The importance of understanding the difference between null and alternative hypotheses is highlighted, with the null hypothesis always having an equal sign.
- 📝 The script covers the concept of p-values and their role in hypothesis testing, explaining how to compare p-values to the significance level (alpha) to make a decision.
- 🤔 The instructor discusses the concept of failing to reject the null hypothesis, which means there is insufficient evidence to support the alternative hypothesis, rather than proving the null hypothesis true.
- 📈 The video includes examples of hypothesis testing for population means, using sample data to test claims about the average values in a population.
- 📊 The process of calculating chi-squared test statistics for hypothesis testing involving standard deviations is explained, including the use of the chi-squared distribution.
- 🔍 The script emphasizes the importance of understanding the steps of hypothesis testing, which can be applied to various statistical scenarios including proportions, means, and standard deviations.
Q & A
What is the main topic of the video?
-The main topic of the video is teaching how to conduct hypothesis testing for population proportions, means, and standard deviations using both calculator functions and manual calculations.
What are the key steps involved in hypothesis testing as discussed in the video?
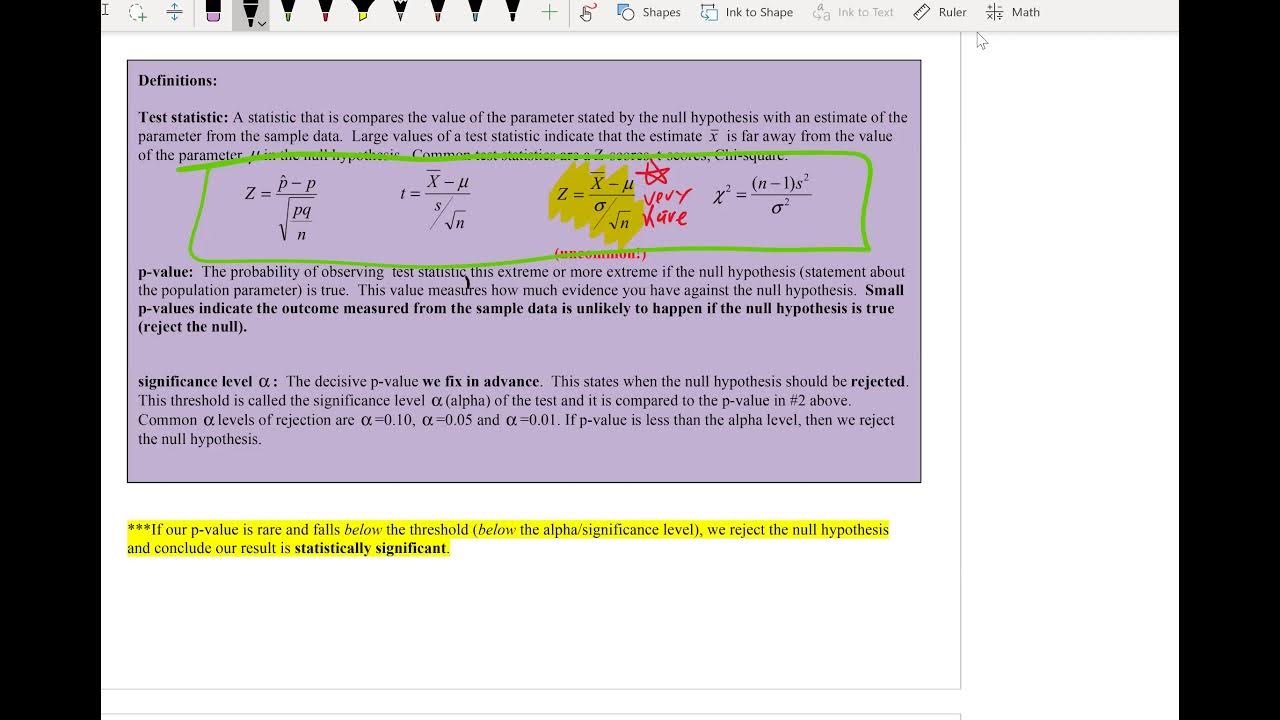
-The key steps involved in hypothesis testing, as discussed in the video, include stating the null and alternate hypotheses, determining the type of test (z-test, t-test, chi-squared test), calculating the test statistic, determining the p-value, making a decision based on the p-value compared to the significance level (alpha), and drawing a conclusion.
What is the difference between a null hypothesis and an alternate hypothesis?
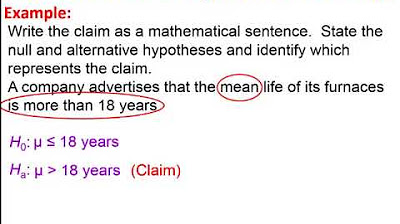
-The null hypothesis (denoted as H0) is a statement of no effect or no difference, often including an equality sign (e.g., µ = 18). The alternate hypothesis (H1 or Ha) is what you might believe to be true, and it does not contain an equality sign (e.g., µ ≠ 18).
What is the significance of the alpha level in hypothesis testing?
-The alpha level (commonly denoted as α) is the probability of rejecting the null hypothesis when it is true. It represents the threshold for deciding whether the results of a test are statistically significant. If the p-value is less than or equal to α, the null hypothesis is rejected.
What is a p-value in the context of hypothesis testing?
-The p-value is the probability of observing the test results (or something more extreme) assuming that the null hypothesis is true. A smaller p-value indicates strong evidence against the null hypothesis.
How does the video instructor suggest using a calculator for hypothesis testing?
-The video instructor suggests using specific calculator functions such as '1 prop z test' for proportion tests, 't-test' for mean tests, and 'chi-squared cdf' for testing standard deviations. The calculator can compute the test statistic and p-value, streamlining the process.
What is the difference between a one-tailed and a two-tailed test?
-A one-tailed test is used when the alternate hypothesis predicts a difference in a specific direction (e.g., greater than or less than). A two-tailed test is used when the alternate hypothesis predicts a difference in any direction (e.g., not equal to).
Why is it necessary to double the p-value in certain situations?
-The p-value needs to be doubled in two-tailed tests because the critical region is split between the two tails of the distribution. This adjustment ensures that the total probability of making a Type I error does not exceed the chosen alpha level.
What does the video script imply about the importance of understanding the steps of hypothesis testing?
-The video script implies that understanding the steps of hypothesis testing is crucial for correctly applying statistical methods, interpreting results, and making informed decisions based on data, especially when using calculators or software that may obscure the underlying process.
Can you provide an example of a hypothesis test for a population mean from the video?
-An example from the video is testing whether adults in America spend a different average number of hours per week on leisure activities than the previously claimed 18 hours. The researcher took a random sample of 10 adults and calculated the sample mean and standard deviation to perform a hypothesis test.
Outlines
📚 Introduction to Chapter 8 Hypothesis Testing
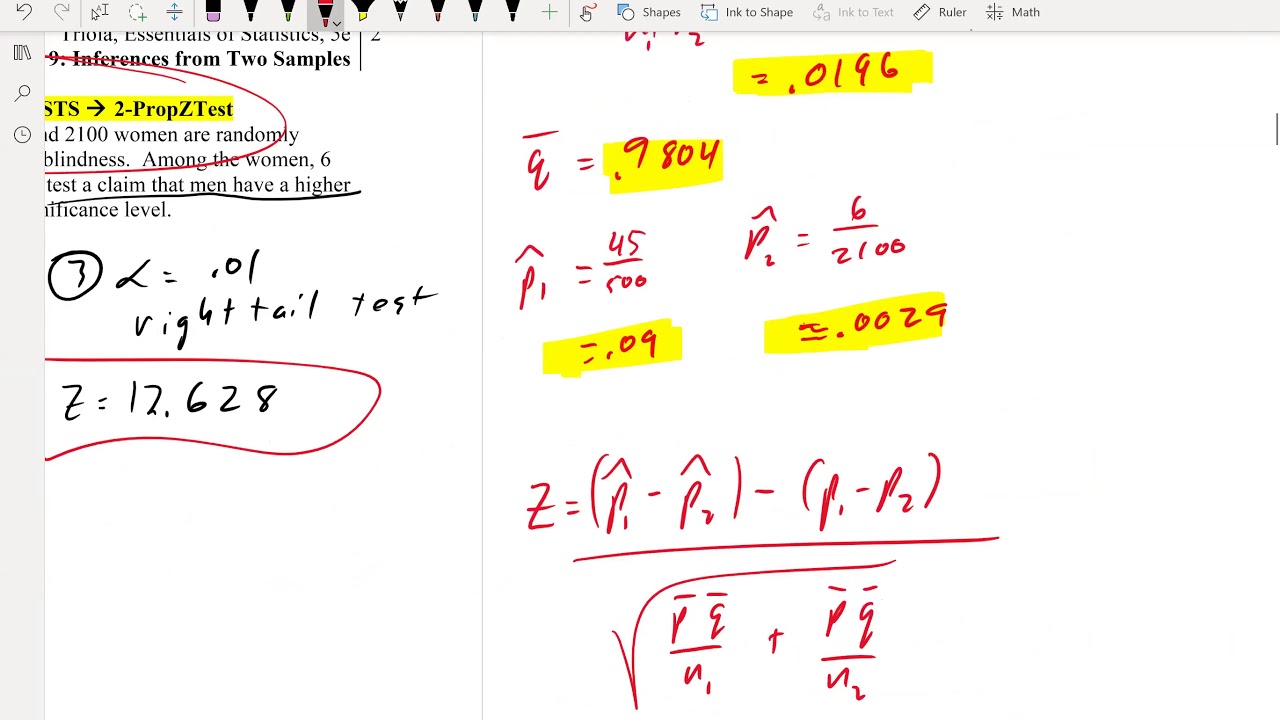
The instructor begins a lesson on hypothesis testing for chapter 8, focusing on sections 8.1 through 8.2, and possibly extending into 8.3. The aim is to complete most of chapter 8 and demonstrate the use of a calculator for hypothesis testing. The specific problem involves a claim about the proportion of religious surfers belonging to a religious community, which is stated to be different from the general population. The claim is that the proportion is 69%, and the task is to test this against a sample of religious surfers to determine if there is a significant difference. The lesson outlines the steps for hypothesis testing, including stating the null hypothesis (p = 0.69) and the alternative hypothesis (p ≠ 0.69), and introduces the concept of a two-tailed test.
🔢 Calculator Usage for Test Statistic
The instructor proceeds to explain how to use a calculator for finding the test statistic in a hypothesis test. The example involves a two-tailed test with a significance level (alpha) of 0.01. The process includes entering values into the calculator for a '1 prop z test', inputting the null hypothesis proportion (p₀ = 0.69), the sample proportion, and indicating the test is two-tailed. The calculator provides the z-score and the p-value, which is then doubled for a two-tailed test to determine the significance of the result. The instructor corrects a previous mistake regarding the doubling of the p-value and emphasizes the importance of this step in hypothesis testing.
🚗 Hypothesis Testing for Sports Car Inspections
The script moves on to another hypothesis test scenario involving sports car owners who believe their vehicles are inspected differently at a state vehicle inspection station compared to family-style cars. Historical data suggests that 30% of all passenger cars fail the inspection on the first attempt. The instructor guides through setting up the hypothesis test, with the null hypothesis being that the proportion of first-time failures for sports cars is equal to the general 30%, and the alternative hypothesis being that it is greater than 30%. The test is a right-tailed test, and the significance level is set at 10%. The instructor demonstrates how to use a calculator to find the z-score and the p-value for this test.
📉 Insufficient Evidence for Sports Car Inspection Bias
After calculating the z-score and p-value using the calculator, the instructor concludes that there is insufficient evidence to support the claim that sports cars are inspected more harshly than other cars. The p-value of 0.186 is greater than the significance level of 0.10, leading to a failure to reject the null hypothesis. This means that based on the sample data, there isn't enough evidence to conclude that the proportion of sports cars failing the inspection is higher than the 30% rate for all passenger cars.
🎯 Hypothesis Testing for Mean Leisure Time
The instructor introduces a new hypothesis test about the mean amount of leisure time adults in America spend per week, which a past study claimed to be 18 hours. A researcher has taken a sample of 10 adults to test if this leisure time is different. The hypothesis test is set up with the null hypothesis (mu = 18) and the alternative hypothesis (mu ≠ 18), indicating a two-tailed test. The significance level is 10%. The instructor explains the steps for calculating the test statistic using the sample mean, standard deviation, and the t-distribution, which is appropriate for hypothesis tests involving means.
📊 Calculation of Test Statistic for Leisure Time
The instructor demonstrates how to calculate the test statistic for the leisure time hypothesis test. Using the sample data provided, the mean (x̄) and standard deviation (s) are entered into the calculator to obtain these values. The test statistic is then calculated using the formula for a t-score, which involves the difference between the sample mean and the claimed mean, divided by the standard error (s/√n). The result is a t-score that will be used to determine the p-value and make a decision about the null hypothesis.
📉 Rejection of Null Hypothesis for Leisure Time
After calculating the test statistic, the instructor proceeds to determine the p-value and make a decision about the null hypothesis. The p-value is found to be 0.024, which is less than the significance level of 0.10. This leads to the rejection of the null hypothesis in favor of the alternative hypothesis that the mean leisure time is different from 18 hours. The instructor emphasizes the importance of understanding the process and being able to justify the statistical decision made.
🧠 Hypothesis Testing for Maze Solving Time
The instructor presents a psychology experiment scenario involving rats navigating mazes. A researcher wants to find a maze that takes rats an average of 45 seconds to solve. The hypothesis test is set up to determine if the maze takes longer than 45 seconds, with the null hypothesis being that the mean time is equal to 45 seconds and the alternative hypothesis being that it is greater than 45 seconds. The test is a right-tailed test with a significance level of 1%. The instructor explains how to use the calculator to find the test statistic and p-value for this test.
🔬 Insufficient Evidence for Maze Time Hypothesis
The instructor concludes the psychology experiment scenario by stating that the p-value of 0.0159 is greater than the significance level of 0.01, leading to a failure to reject the null hypothesis. This means there is insufficient evidence to support the claim that the maze takes longer than 45 seconds for rats to solve. The instructor emphasizes the importance of understanding the process of hypothesis testing and being able to interpret the results correctly.
📏 Hypothesis Testing for Standard Deviation of Pennies
The instructor discusses a scenario where the U.S. Mint requires pennies to have a mean weight of 2.5 grams and a standard deviation of 0.0230 grams. A sample of 30 pennies has a mean weight of 2.4991 grams and a standard deviation of 0.01648 grams. The hypothesis test is set up to determine if the standard deviation is less than what the U.S. Mint specifies, with the null hypothesis being that the standard deviation is equal to 0.0230 grams and the alternative hypothesis being that it is less. The test is a left-tailed test with a significance level of 5%. The instructor explains how to calculate the test statistic using the chi-squared distribution and find the p-value.
📉 Rejection of Null Hypothesis for Penny Weight Standard Deviation
After calculating the test statistic and the p-value, which is 0.0141, the instructor concludes that the p-value is less than the significance level of 0.05, leading to the rejection of the null hypothesis. This supports the claim that the standard deviation of the weight of pennies is less than what the U.S. Mint specifies. The instructor wraps up by summarizing the steps and processes involved in hypothesis testing for standard deviation and variance, and mentions plans to cover confidence intervals in a future video.
Mindmap
Keywords
💡Hypothesis Testing
💡Null Hypothesis (H0)
💡Alternative Hypothesis (H1 or Ha)
💡Significance Level (Alpha)
💡P-Value
💡Test Statistic
💡Type I Error
💡Type II Error
💡Chi-Squared Test
💡T-Test
💡Z-Test
💡Population Proportion
💡Sample Mean (x̄)
💡Sample Size (n)
💡Standard Deviation (s)
💡Calculator Functions
Highlights
Introduction to hypothesis testing for chapter 8, focusing on using a calculator to find test statistics.
Explanation of how to set up null and alternative hypotheses for a claim about a proportion.
Demonstration of using a calculator for a two-tailed test in hypothesis testing.
Clarification on the difference between null and alternative hypotheses and their relationship to equal signs.
Instruction on identifying the type of tail test (left, right, or two-tailed) based on the alternative hypothesis.
Guide on calculating the test statistic using a calculator for a proportion z-test.
Discussion on the importance of doubling the p-value for two-tailed tests when not using a calculator.
Illustration of how to interpret the p-value in relation to the significance level (alpha) to make a statistical decision.
Explanation of failing to reject the null hypothesis and its implications for the evidence in support of a claim.
Transition to hypothesis testing for means, including the formula for the test statistic.
Use of a calculator to find the mean and standard deviation from a given data set.
Calculation of the test statistic for a mean using sample data and the formula.
Comparison of manual calculation with calculator results for verification of test statistic and p-value.
Introduction of hypothesis testing for standard deviation and variance using the chi-squared distribution.
Process of calculating the chi-squared test statistic when the population standard deviation is known.
Use of the chi-squared distribution to find the p-value for a hypothesis test on standard deviation.
Decision-making in hypothesis testing based on the p-value compared to the significance level.
Conclusion on the evidence for the claim about standard deviation being less than specified by the U.S. mint.
Transcripts
Browse More Related Video
Math 119 Chapter 9 part 1
Math 119 Chap 8 part 1
9.2.2 Two Means, Independent Samples - The Rationale Behind The Equivalent Methods, P-value Method
8.1.3 Basics of Hypothesis Testing - Computing and Interpreting Test Statistics
9.2.3 Two Means, Indep. Samples - Critical Value Method, St. Deviations Unknown, Not Assumed Equal
Elementary Statistics Chapter 8 - Introduction Hypothesis Testing Part 1 Lesson 1
5.0 / 5 (0 votes)
Thanks for rating: