Elementary Statistics - Chapter 9 - Inferences from Two Samples
TLDRThis script offers a comprehensive guide to hypothesis testing with two samples, explaining the process of formulating null and alternative statements, selecting the appropriate test (Z-test or t-test), and calculating critical values and test statistics using a calculator. It covers scenarios with equal or unequal variances, as well as tests for proportions, emphasizing the importance of correctly identifying the claim's position and the type of test to apply for accurate hypothesis testing.
Takeaways
- 📚 The script discusses the process of hypothesis testing for two independent samples, emphasizing the importance of the assumption that the samples come from distinct populations.
- 📝 When formulating a hypothesis statement for a two-sample test, the claim is stated first, followed by its complement, similar to a one-sample test.
- 🧐 The null hypothesis generally assumes no difference between population means, using inequality statements to allow for the complement in the alternative hypothesis.
- 📉 For a Z-test comparing two population means, conditions include known population standard deviations, random and independent sampling, and normal distribution or large sample sizes.
- 🔢 The critical value for a Z-test is found using the level of significance (alpha) and can be determined with a calculator or a Z-table.
- 📊 The test statistic in a Z-test is calculated using sample means, population standard deviations, and sample sizes, and is compared to the critical value to determine if the null hypothesis is rejected.
- 📉 In the case of a t-test, it is used when sample sizes are less than 30, and the samples are from normally distributed populations, meeting conditions of random selection and independence.
- 🔍 The degree of freedom for a t-test is determined based on the equality of variances and is used to find the critical value from a t-distribution table or calculator.
- 📝 The script provides detailed steps for using a calculator to find test statistics for both Z-tests and t-tests, including navigating through menu options and interpreting results.
- 🔑 The decision to reject or fail to reject the null hypothesis is based on whether the test statistic falls into the rejection region determined by the critical value and the alternative hypothesis.
- 📑 Examples are provided throughout the script to illustrate the application of hypothesis testing in real-world scenarios, such as comparing average costs, credit card debts, and telephone ranges.
Q & A
What is the purpose of a two-sample hypothesis test?
-A two-sample hypothesis test is used to compare data from two different samples to determine if they come from distinct populations or if they are independent of each other. It helps in making inferences about the population means or proportions based on the sample data.
What are the conditions necessary to perform a Z-test for the difference between two population means?
-To perform a Z-test for the difference between two population means, you need to know both population standard deviations, ensure the samples are random and independent, and that the populations are normally distributed or both sample sizes are at least 30.
How do you state the hypotheses for a two-sample hypothesis test?
-In a two-sample hypothesis test, you start with a null hypothesis that states there is no difference between the population means or proportions (usually denoted as equal to each other). Then you state the alternative hypothesis, which is the complement of the null hypothesis, indicating the direction of the expected difference (less than, greater than, or not equal to).
What is the significance of using inequality statements in the null hypothesis?
-Using inequality statements in the null hypothesis allows for a clear complement to be stated in the alternative hypothesis. This helps in setting up the correct critical regions for the test and ensures that the test is conducted in the appropriate direction based on the alternative hypothesis.
How do you find the critical value for a Z-test?
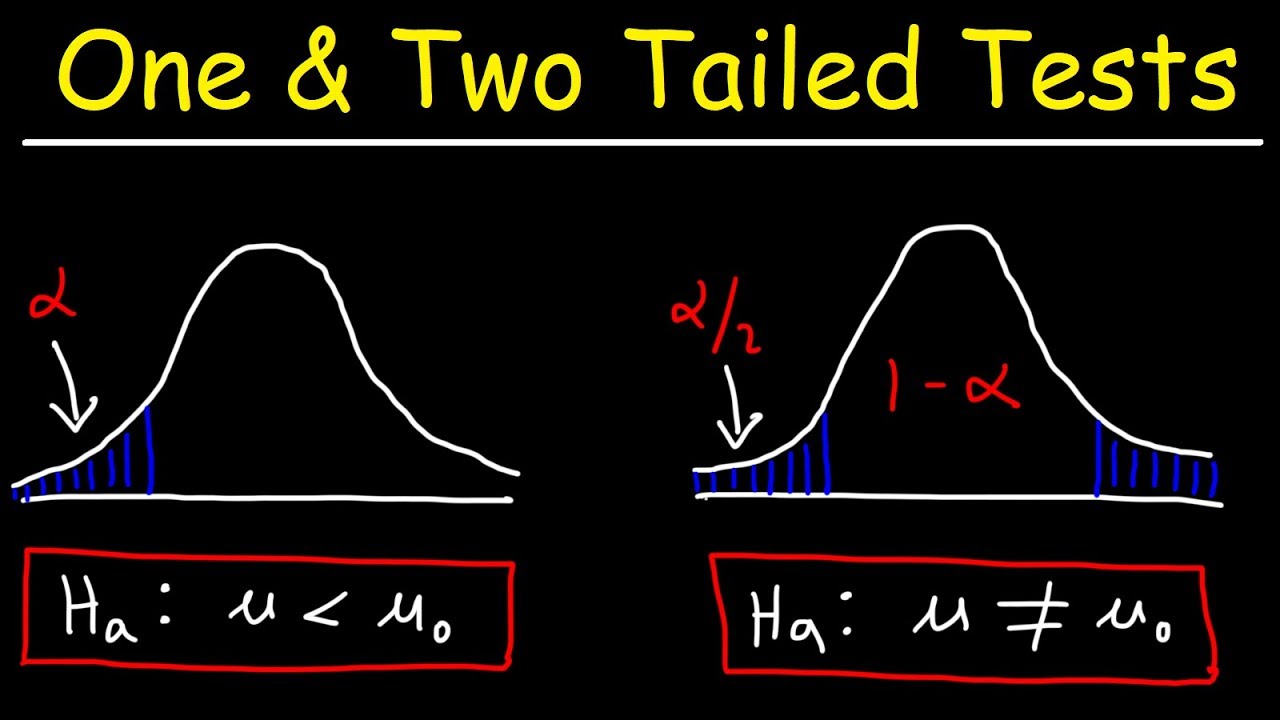
-The critical value for a Z-test is found using the level of significance (alpha) and a standard normal distribution table or calculator. Depending on the type of test (one-tailed or two-tailed), you will find the Z-score that corresponds to the area under the curve represented by alpha or (1 - alpha) for the tail(s) of the distribution.
What is the formula for the test statistic in a two-sample Z-test?
-The test statistic for a two-sample Z-test is calculated using the formula: (X1 - X2) / sqrt((σ1^2/n1) + (σ2^2/n2)), where X1 and X2 are the sample means, σ1 and σ2 are the population standard deviations, and n1 and n2 are the sample sizes.
What is the difference between a two-sample Z-test and a two-sample t-test?
-A two-sample Z-test is used when the population standard deviations are known and the sample sizes are large (usually both greater than 30). A two-sample t-test is used when the population standard deviations are unknown and/or the sample sizes are small, and it follows the t-distribution rather than the normal (Z) distribution.
How do you determine whether to use a Z-test or a t-test for comparing two sample proportions?
-You determine whether to use a Z-test or a t-test based on the conditions of the problem. If the sample sizes are large enough (typically both greater than 30) and the population proportions are known, a Z-test can be used. If the sample sizes are smaller or the population proportions are unknown, a t-test is more appropriate.
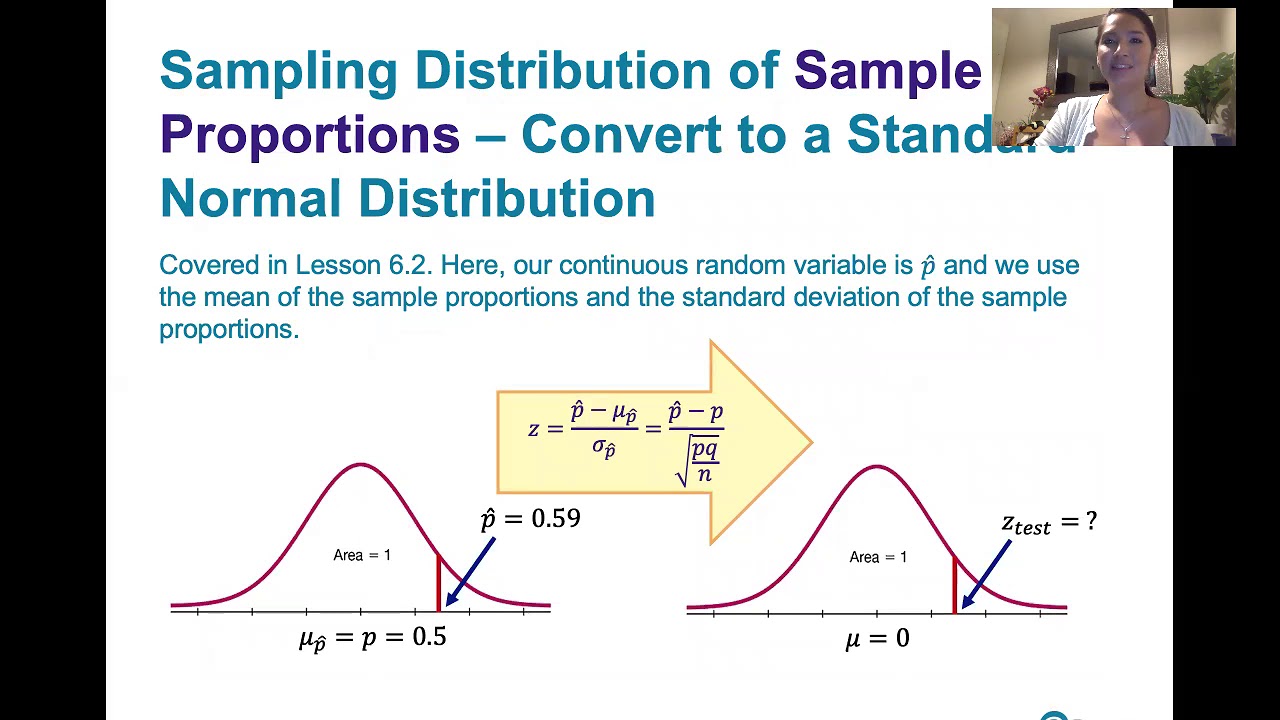
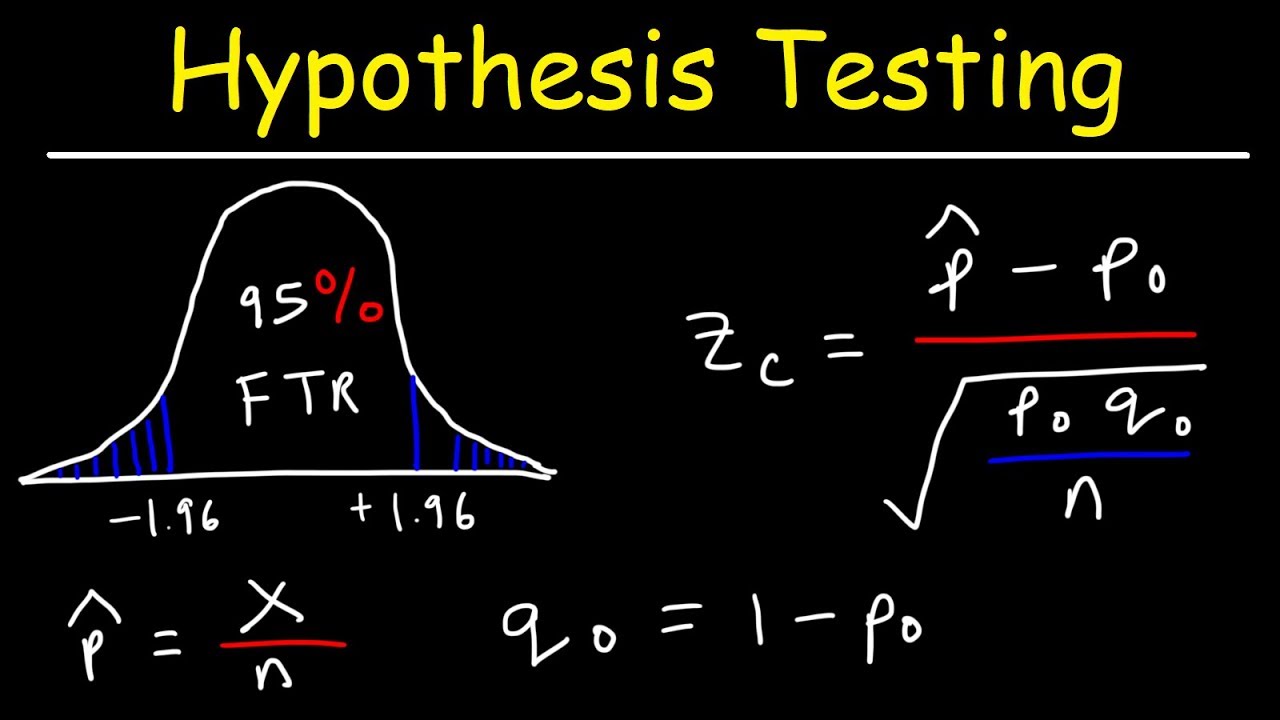
What is the formula for the standardized test statistic for comparing two sample proportions?
-The standardized test statistic for comparing two sample proportions is calculated using the formula: (p1 - p2) / sqrt(Pbar * (1 - Pbar) * (1/n1 + 1/n2)), where p1 and p2 are the sample proportions, Pbar is the pooled proportion, and n1 and n2 are the sample sizes.
How do you interpret the results of a two-sample hypothesis test?
-The results of a two-sample hypothesis test are interpreted by comparing the test statistic to the critical value(s). If the test statistic falls into the rejection region defined by the critical value(s), you reject the null hypothesis in favor of the alternative hypothesis. If it does not fall into the rejection region, you fail to reject the null hypothesis. The interpretation should also consider the original claim or research question.
Outlines
🔍 Two Sample Hypothesis Testing Overview
This paragraph introduces the concept of two sample hypothesis testing, which involves comparing data from two independent samples, assuming they come from distinct populations. It explains the process of stating hypotheses, including null and alternative hypotheses, and the importance of considering the samples as independent. The conditions necessary for performing a Z-test for the difference between two population means are outlined, such as knowledge of population standard deviations, random and independent sampling, and normal distribution or large sample sizes. The paragraph also discusses how to find critical values using significance levels and the concept of rejecting or failing to reject the null hypothesis based on test statistics and critical values.
📊 Z-Test Calculation and Hypothesis Testing Steps
The paragraph delves into the specifics of calculating the Z-test for two sample means, emphasizing the formula for the test statistic and the conditions under which it is used. It provides a step-by-step guide on how to use a calculator to find the test statistic, including entering sample means, standard deviations, and sample sizes. The process of determining the critical value based on the significance level and the type of test (one-tailed or two-tailed) is explained. The paragraph also illustrates how to compare the test statistic to the critical value to make a decision on the null hypothesis, with examples of left-tailed, right-tailed, and two-tailed tests.
📝 Example of Hypothesis Testing with Travel Agency Claim
This paragraph presents a practical example of hypothesis testing involving a travel agency's claim about the average daily cost of meals and lodging in Texas versus Virginia. It guides through the process of stating hypotheses, selecting the correct test (two-sample Z-test), inputting data into a calculator, and interpreting the results to determine if there is enough evidence to support the claim. The importance of correctly entering data and selecting the right alternative hypothesis in the calculator is highlighted.
📉 Hypothesis Testing Decision Making and Credit Card Debt Example
The paragraph discusses the decision-making process in hypothesis testing, using an example of a credit card watchdog group's claim about differences in mean credit card debts between California and Illinois households. It explains how to state null and alternative hypotheses, calculate critical values for a two-tailed test, and find the test statistic using a calculator. The interpretation of the test statistic's comparison with the critical value to either reject or fail to reject the null hypothesis is emphasized, along with the correct wording based on the original claim.
🔢 T-Test Conditions and Critical Value Calculation
This paragraph explains the conditions necessary for conducting a T-test for small independent samples, including random selection, independence, and normal distribution. It details the process of finding the critical value for the T distribution, emphasizing the importance of determining whether the variances are equal or not to calculate the correct degrees of freedom. The paragraph outlines how to use a calculator to find the critical value and the steps involved in hypothesis testing, including identifying the null and alternative hypotheses, finding the test statistic, and comparing it to the critical value.
📚 T-Test Calculation and Example with State Mathematics Test
The paragraph provides an in-depth look at calculating the T-test statistic using a calculator, with an example of a state mathematics test for students taught by two different teachers. It explains how to input data for the two-sample T-test, the importance of highlighting the correct alternative hypothesis, and interpreting the test statistic to make a decision on the null hypothesis. The paragraph also discusses the implications of the test result for the claim about the difference in mean mathematics test scores.
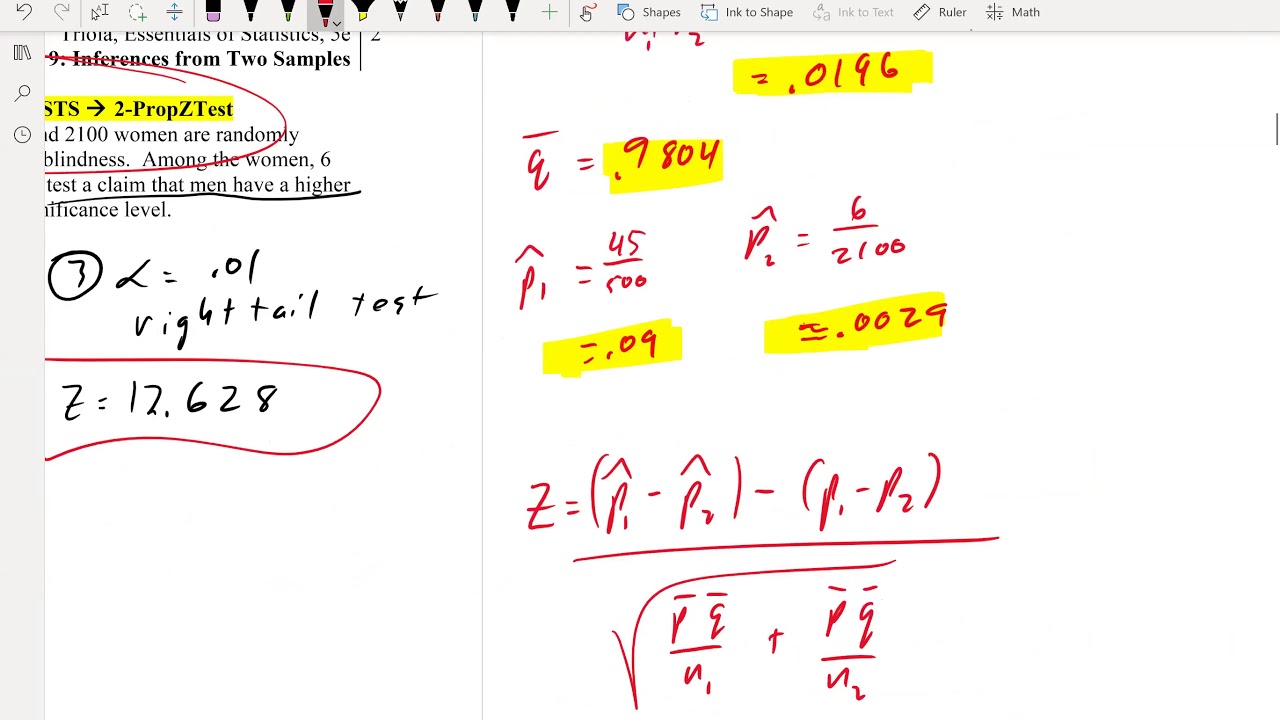
📞 Two-Sample Z-Test for Proportions and Conditions
This paragraph introduces the two-sample Z-test for proportions, outlining the conditions required for conducting the test, such as random selection, independence, and a minimum number of successes and failures in both samples. It explains how to find the critical value using the Z-score and the significance level, and how to calculate the test statistic using sample proportions and a weighted estimate of the population proportion. The paragraph emphasizes the importance of correctly identifying the number of successes and using the calculator to perform the test.
🛡️ Seatbelt Usage Proportion Test Example
The paragraph presents an example of using the two-sample Z-test for proportions to determine if there is a difference in the proportion of occupants who wear seatbelts in passenger cars and pickup trucks. It guides through the process of finding the number of successes, stating hypotheses, identifying critical values, and calculating the test statistic using a calculator. The interpretation of the test statistic's comparison with the critical value to reject or fail to reject the null hypothesis is discussed, along with the correct conclusion based on the test result.
💊 Cholesterol-Reducing Medicine Effectiveness Test
This paragraph discusses a medical study's hypothesis test to determine if cholesterol-reducing medicine lowers the death rate due to heart disease. It explains how to state the null and alternative hypotheses, calculate critical values, and find the test statistic using the given data. The paragraph illustrates the process of comparing the test statistic with the critical value to make a decision on the null hypothesis and interpret the result to support the claim about the medicine's effectiveness.
📈 Conclusion and Evidence Interpretation in Hypothesis Testing
The final paragraph wraps up the discussion on hypothesis testing by emphasizing the importance of correctly interpreting the results to support or reject claims. It provides examples of how to state hypotheses, find critical values, calculate test statistics, and compare them to the critical region to make informed decisions. The paragraph highlights the need for accurate calculations and clear communication of the test results to support or refute the original claims made in the studies.
Mindmap
Keywords
💡Hypothesis Testing
💡Independent Samples
💡Critical Value
💡Z-Test
💡T-Test
💡Level of Significance
💡Test Statistic
💡Degrees of Freedom
💡Rejection Region
💡Proportions Test
Highlights
Two-sample hypothesis tests compare data from independent samples, assuming they come from distinct populations.
The null hypothesis typically assumes no difference between population means, while the alternative hypothesis states a difference.
When stating hypotheses, the null hypothesis uses inequality to allow for a complement in the alternative hypothesis.
Z-tests for two-sample hypotheses require knowledge of population standard deviations, random and independent sampling, and normal distribution or large sample sizes.
Critical values for Z-tests are found using the level of significance and can be determined with calculators or tables.
The test statistic for a Z-test is calculated using sample means, population standard deviations, and sample sizes.
For t-tests with small sample sizes, the conditions include random selection, independence, and normal distribution of populations.
The degree of freedom for t-tests is determined by sample sizes and variance equality.
Critical values for t-tests are found based on the level of significance and degree of freedom.
The test statistic for a t-test uses a formula that accounts for sample means, standard deviations, and sample sizes.
Z-tests and t-tests involve comparing the test statistic to the critical value to determine if the null hypothesis is rejected.
Interpreting the results of hypothesis tests requires understanding the original claim and the direction of the alternative hypothesis.
Examples provided demonstrate the application of hypothesis testing in various scenarios, such as comparing daily costs of meals and lodging.
The importance of correctly identifying the claim, null, and alternative hypotheses before conducting hypothesis tests.
The use of calculator functions to assist in finding critical values and test statistics for both Z-tests and t-tests.
The process of hypothesis testing is illustrated through step-by-step examples, including setting up hypotheses, finding critical values, calculating test statistics, and making conclusions.
The transcript emphasizes the correct interpretation of results based on whether the claim is associated with the null or alternative hypothesis.
The application of hypothesis testing to proportions, including conditions for conducting such tests and the use of Z-scores.
The calculation of test statistics for proportions involves determining the number of successes and using sample proportions.
The final examples demonstrate the use of hypothesis testing in medical research to compare death rates and support claims about treatment effectiveness.
Transcripts
Browse More Related Video
8.1.3 Basics of Hypothesis Testing - Computing and Interpreting Test Statistics

t-Test - Full Course - Everything you need to know
One Tailed and Two Tailed Tests, Critical Values, & Significance Level - Inferential Statistics
Hypothesis Testing - Solving Problems With Proportions
Math 119 Chapter 9 part 1

AP Statistics 2020 Review: Choosing Hypothesis Tests
5.0 / 5 (0 votes)
Thanks for rating: