7.2.4 Estimating a Population Mean - Sample Size for a Desired Margin of Error and Confidence Level
TLDRThis educational video script covers the process of determining the necessary sample size to estimate a population mean with a specified degree of accuracy and confidence level. It introduces the formulas for calculating the margin of error when the population standard deviation is known, and then demonstrates how to rearrange these formulas to solve for the sample size. The script also addresses scenarios where the population standard deviation is unknown, suggesting methods such as using the range rule of thumb, calculating a sample standard deviation, or relying on previous studies for estimation. An example is provided to illustrate the calculation for estimating the mean IQ score of attorneys with a 98% confidence level and a margin of error of three points, rounding up to ensure accuracy.
Takeaways
- 📚 The video discusses learning outcome number four of lesson 7.2, focusing on how to determine the necessary sample size to estimate a population mean with a desired degree of accuracy and confidence level.
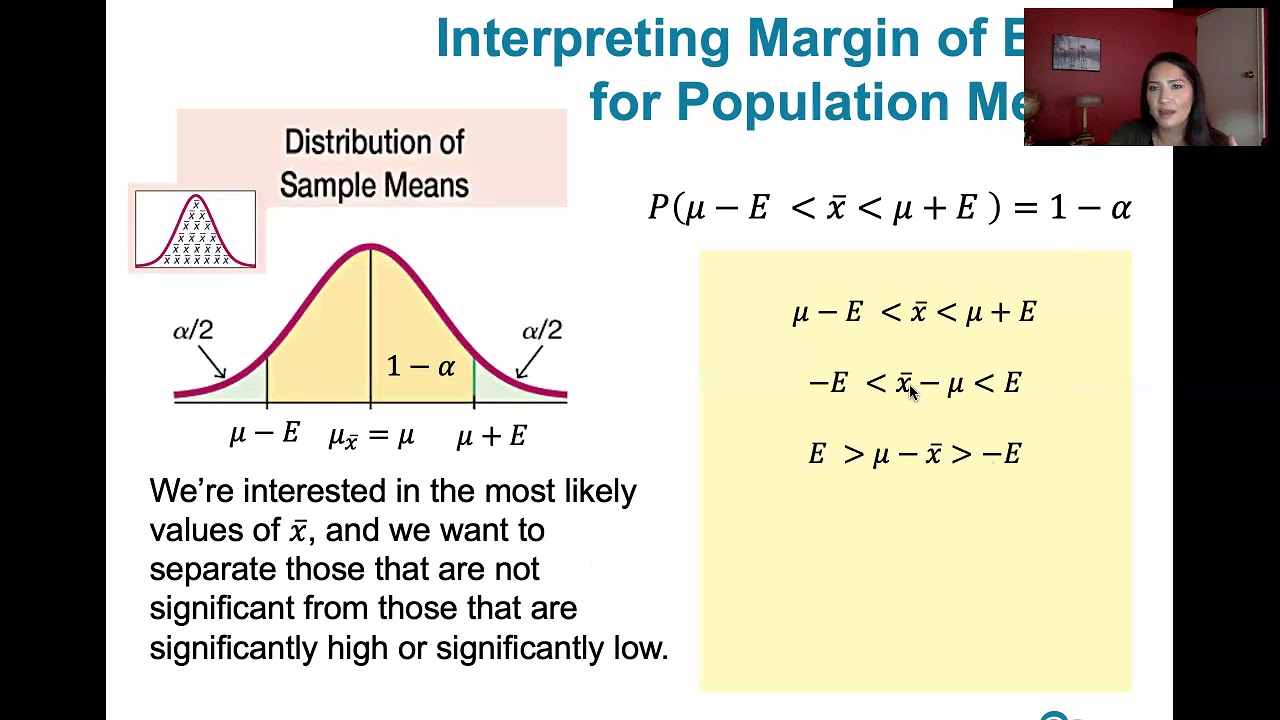
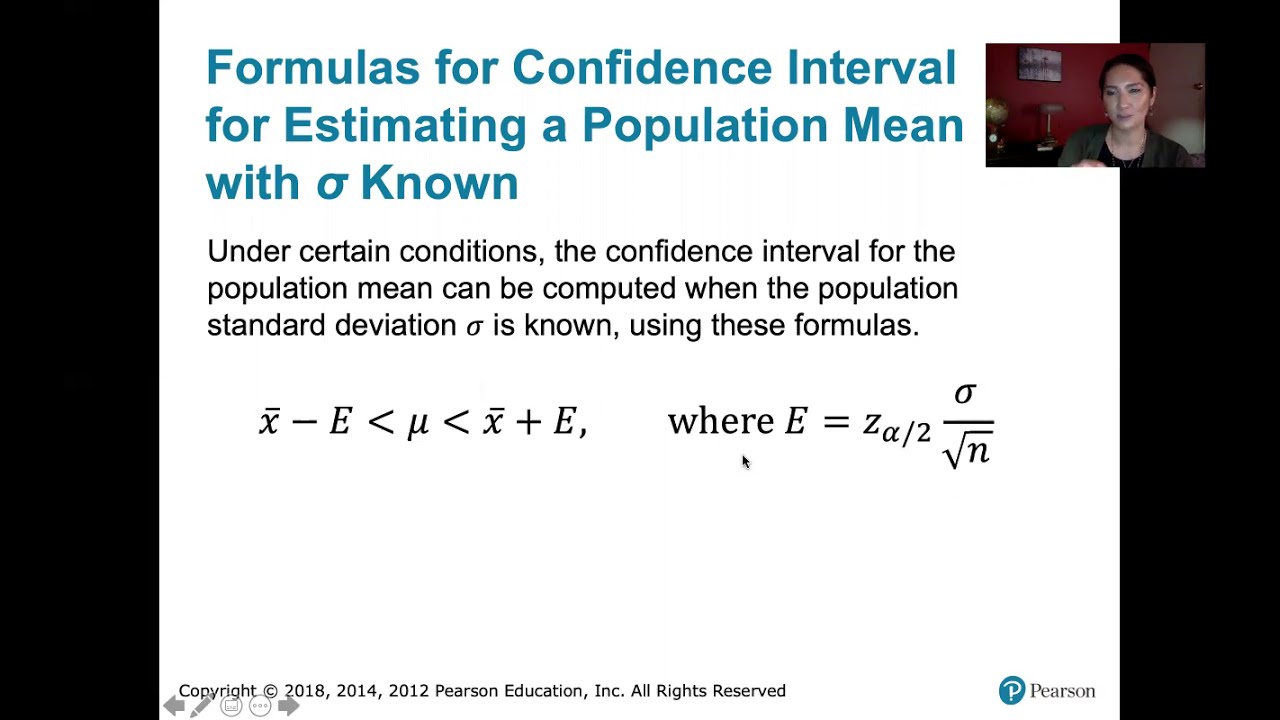
- 📉 The script explains the formulas for the confidence interval of a population mean, particularly when the population standard deviation (sigma) is known.
- 🔍 The margin of error is calculated using the formula involving the z-score (z sub alpha over two), the population standard deviation, and the square root of the sample size.
- 🔢 To find the sample size needed for a given margin of error and confidence level, the formula is rearranged to solve for 'n', the sample size.
- ⚖️ The importance of rounding up the calculated sample size to ensure less than the intended margin of error is emphasized.
- 📈 The script reviews the notation for confidence intervals, including symbols for population mean (mu), sample size (n), sample mean (x bar), desired margin of error (e), population standard deviation (sigma), and z-score (z sub alpha over two).
- 🤔 The video addresses the common scenario where the population standard deviation is unknown, suggesting methods such as estimating it using the range rule of thumb, computing a sample standard deviation, or using values from previous studies.
- 🧩 An example is provided to illustrate the process of calculating the required sample size to estimate the mean IQ score of attorneys with a 98% confidence level and a margin of error of three IQ points.
- 📊 The video demonstrates how to use Excel or a z-table to find the z-score corresponding to a given confidence level, in this case, 98%.
- 🔑 The final step in the example is to plug the values into the rearranged formula to find the sample size, rounding up to the nearest whole number to ensure accuracy.
- 🔗 The script concludes by explaining the confidence interval's significance in estimating population parameters, highlighting that with 98% confidence, the true mean IQ score of attorneys would be within a six-point range based on the sample.
Q & A
What is the main topic of the video?
-The main topic of the video is determining the necessary sample size to estimate a population mean with a desired degree of accuracy and confidence level when the population standard deviation is known.
What is the formula for the margin of error when the population standard deviation is known?
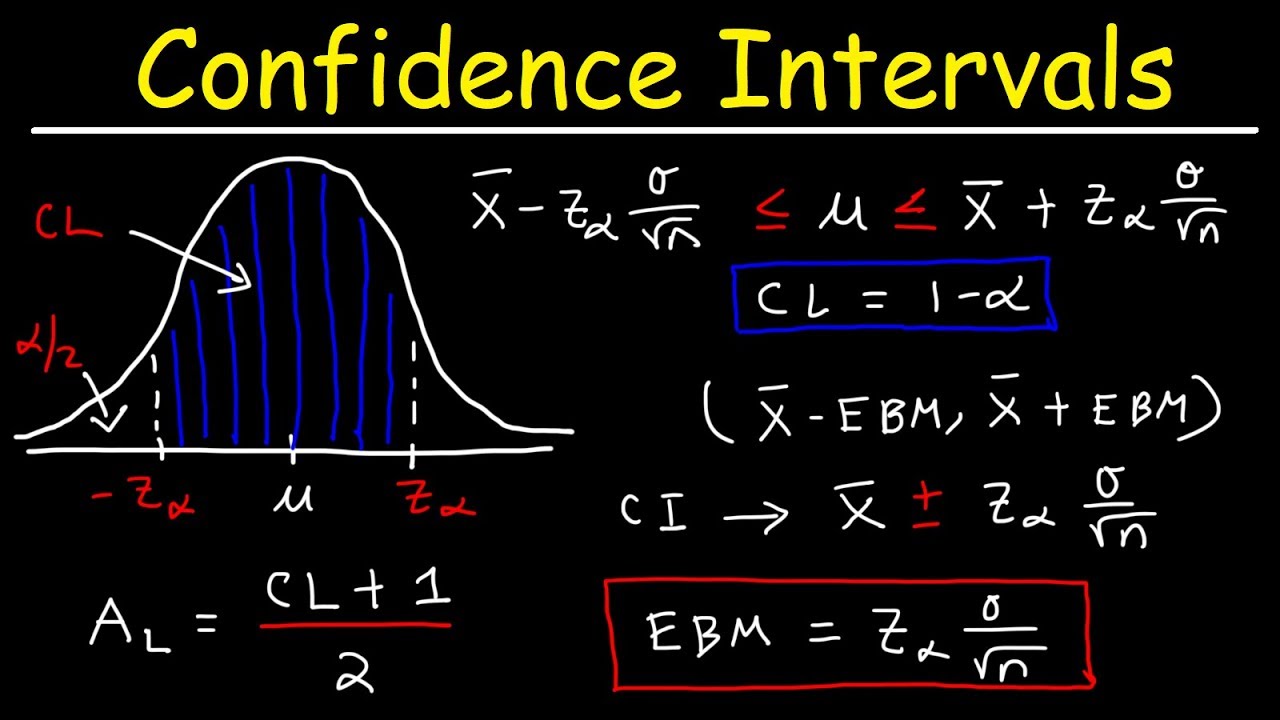
-The margin of error is calculated as \( z_{\alpha/2} \times \frac{\sigma}{\sqrt{n}} \), where \( z_{\alpha/2} \) is the z-score from the standard normal distribution, σ is the population standard deviation, and n is the sample size.
How is the sample size formula derived from the margin of error formula?
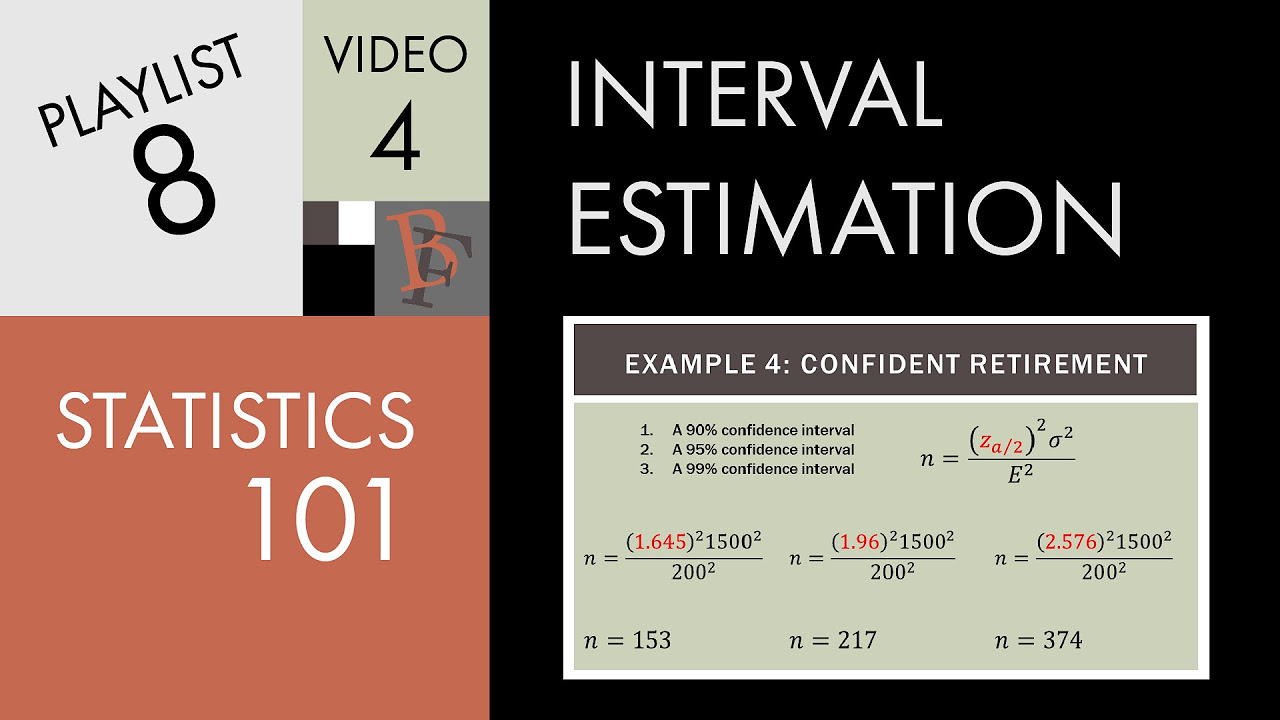
-The sample size formula is derived by rearranging the margin of error formula to solve for n, resulting in \( n = \left(\frac{z_{\alpha/2} \times \sigma}{E}\right)^2 \), where E is the desired margin of error.
Why should we round up the calculated sample size?
-We round up the calculated sample size to ensure that the margin of error is not larger than intended. Rounding up reduces the error, which is preferable to having more error than necessary.
What is the significance of the z-score in the context of this video?
-The z-score represents the critical value from the standard normal distribution that corresponds to the desired confidence level and is used to calculate the margin of error and sample size.
What is the role of the confidence level in determining the sample size?
-The confidence level dictates the proportion of the area under the standard normal curve that falls within the confidence interval, which in turn affects the z-score and the required sample size.
What are the alternatives if the population standard deviation is unknown?
-If the population standard deviation is unknown, alternatives include using the range rule of thumb to estimate it, calculating a sample standard deviation from initial data, or using values from previous studies.
What is the range rule of thumb for estimating the population standard deviation?
-The range rule of thumb states that the range (maximum value minus minimum value) divided by four gives a rough estimate of the population standard deviation.
How can we find the z-score corresponding to a given confidence level using Excel?
-In Excel, you can use the function `=NORM.INV(1 - alpha/2)` to find the z-score, where alpha is the significance level corresponding to the (1 - confidence level).
Can you provide an example of calculating the required sample size based on the video script?
-Sure, given a population standard deviation of 15, a desired margin of error of 3 IQ points, and a 98% confidence level, the sample size required would be calculated as \( n = \left(\frac{2.33 \times 15}{3}\right)^2 \), which equals approximately 136, and rounded up to ensure accuracy.
What does it mean to have a 98% confidence level in the context of estimating a population mean?
-A 98% confidence level means that if the sampling process is repeated 100 times, the true population mean would fall within the calculated confidence interval in 98 of those instances.
Outlines
📊 Estimating Population Mean with Confidence Intervals
This paragraph introduces the concept of estimating a population mean with a specific degree of accuracy and confidence level. It explains the use of formulas for the confidence interval when the population standard deviation (sigma) is known. The margin of error is calculated using a z-score from the standard normal distribution, the population standard deviation, and the square root of the sample size. The paragraph also discusses how to determine the necessary sample size to achieve a desired margin of error and confidence level by rearranging the error formula and solving for the sample size (n). It emphasizes the importance of rounding up the sample size to ensure the margin of error is not exceeded.
🔍 Alternatives When Population Standard Deviation is Unknown
The second paragraph addresses the common scenario where the population standard deviation is not known. It suggests several methods to estimate it, such as using the range rule of thumb (dividing the range by four), calculating a sample standard deviation from initial data collection, or using values from previous studies. The paragraph provides an example of estimating the mean IQ score for attorneys, using a conservative standard deviation of 15, and explains how to calculate the required sample size for a 98% confidence level with a margin of error of three IQ points.
📚 Calculating the Sample Size with Given Parameters
The final paragraph demonstrates the process of calculating the sample size needed to estimate the mean IQ score of attorneys with a 98% confidence level and a margin of error of three points, using the conservative standard deviation of 15. It involves finding the z-score corresponding to the desired confidence level, plugging in the values into the sample size formula, and rounding up to the nearest whole number. The paragraph concludes with the finding that at least 136 IQ tests are needed to achieve the desired confidence interval, and it explains the implications of this sample size for the confidence level and margin of error.
Mindmap
Keywords
💡Sample Size
💡Population Mean
💡Confidence Interval
💡Margin of Error
💡Z-Score
💡Population Standard Deviation
💡Sample Mean
💡Confidence Level
💡Alpha
💡Estimation
Highlights
The video discusses learning outcome number four of lesson 7.2, focusing on estimating a population mean with desired accuracy and confidence.
Introduction of formulas for the confidence interval for estimating a population mean when the population standard deviation is known.
Explanation of the margin of error formula using z-score and population standard deviation divided by the square root of the sample size.
The necessity of sample size calculation for achieving a desired margin of error and confidence level.
Rearranging the error formula to solve for the sample size n, given the margin of error and z-score.
The importance of rounding up the sample size to ensure less than intended error in the estimation.
Review of notation for confidence intervals of population means, including symbols for population mean, sample size, sample mean, margin of error, and z-score.
Discussion on the use of z-scores in relation to sample statistics and confidence levels.
Strategies for estimating the population standard deviation when it is unknown, including the range rule of thumb and using sample standard deviation.
The range rule of thumb states that dividing the range by four gives a rough estimate of the standard deviation.
The option to start sample collection without knowing the population standard deviation and refine the estimate as more data is collected.
Using previous study results to estimate the population standard deviation if known.
An example problem estimating the mean IQ score for attorneys with a given population standard deviation and desired confidence level.
The conservative nature of using the general population standard deviation for a specific group like attorneys.
Calculation of the required sample size for a 98% confidence level with a margin of error of three IQ points.
Explanation of finding the z-score corresponding to a 98% confidence level using Excel or a z-table.
The final calculation resulting in a sample size of at least 136 attorney IQ scores for the desired confidence interval.
The interpretation of the confidence interval and its implications for the reliability of the estimated mean IQ score of attorneys.
Transcripts
Browse More Related Video
7.2.0 Estimating a Population Mean - Lesson Overview, Key Concepts, Learning Outcomes
Statistics 101: Confidence Intervals, Estimating Sample Size Needed
7.1.6 Estimating a Pop. Proportion - The Right Sample Size for a Given Error and Confidence Level
How To Find The Z Score, Confidence Interval, and Margin of Error for a Population Mean
7.2.2 Estimating a Population Mean - Sample Mean, Margin of Error, and Finding Confidence Intervals
7.2.5 Estimating a Population Mean - Confidence Intervals with Known Pop. Standard Deviation
5.0 / 5 (0 votes)
Thanks for rating: