5.1.4 Discrete Probability Distributions - The Range Rule of Thumb and Significant Values
TLDRThis video explains the 'range rule of thumb' for determining if a random variable's value is significantly high or low. It emphasizes that values more than two standard deviations from the mean are considered significant. Using a probability distribution, the mean and standard deviation can be calculated to identify these values. The video illustrates this with an example of an X-linked genetic disorder, calculating the mean and standard deviation, and then applying the rule to determine if outcomes of zero or five children inheriting the disorder are statistically significant.
Takeaways
- 📚 The video discusses the 'range rule of thumb' for determining if a value of a random variable is significantly high or low.
- 📏 The rule states that values more than two standard deviations from the mean are considered significantly high or low.
- 📉 Significantly low values are those that are at the mean minus two standard deviations or lower.
- 📈 Significantly high values are those that are at the mean plus two standard deviations or higher.
- 🔢 The mean and standard deviation can be calculated using a probability distribution.
- 📋 The range rule of thumb is not rigid; some might use three standard deviations or a different number.
- 📊 Values within two standard deviations of the mean are not considered significant in a statistical sense.
- 🧬 The example given involves a genetic disorder with five males, where the random variable is the number of children who inherit the disorder.
- 👶 The mean number of children inheriting the disorder was found to be 2.5, with a standard deviation of about 1.1.
- ✏️ Using the calculated mean and standard deviation, the video shows how to determine if outcomes are significantly high or low.
- 📝 The outcomes of zero or five children inheriting the disorder are considered significantly low and high, respectively, while one to four are not statistically significant.
Q & A
What is the main topic of the video?
-The main topic of the video is the application of the range rule of thumb to determine if a given value of a random variable is significantly high or low, using a probability distribution.
What is the range rule of thumb mentioned in the video?
-The range rule of thumb states that values more than two standard deviations from the mean are considered significantly high or low.
What values are considered significantly low according to the range rule of thumb?
-Significantly low values are those that are the mean minus two standard deviations or lower.
What values are considered significantly high according to the range rule of thumb?
-Significantly high values are those that are the mean plus two standard deviations or higher.
What is the significance of values within two standard deviations of the mean?
-Values within two standard deviations of the mean are not considered significant in a statistical sense.
Is the choice of two standard deviations from the mean a rigid rule?
-No, the choice of two standard deviations is not rigid; it is a preference used in the course and can vary among different sources.
What is the random variable in the example involving five males with an X-linked genetic disorder?
-The random variable is the number of children among the five who inherit the disorder.
What was the mean number of children who inherited the disorder in the example?
-The mean number of children who inherited the disorder was found to be 2.5 children.
What was the standard deviation of the number of children who inherited the disorder in the example?
-The standard deviation was found to be about 1.1 children.
How do you calculate significantly low values for the given example?
-To calculate significantly low values, you subtract twice the standard deviation from the mean, which in this case is 2.5 - 2 * 1.1 = 0.3 or lower.
How do you calculate significantly high values for the given example?
-To calculate significantly high values, you add twice the standard deviation to the mean, which is 2.5 + 2 * 1.1 = 4.7 or higher.
What does the video script suggest about the outcomes of zero or five children inheriting the disorder?
-The script suggests that zero children inheriting the disorder is significantly low, and five children inheriting the disorder is significantly high in a statistical sense.
What is the significance of the number of children inheriting the disorder being between one and four?
-The number of children inheriting the disorder being between one and four is not considered significant in a statistical sense, as it falls within two standard deviations of the mean.
Outlines
📊 Understanding Statistical Significance with Range Rule of Thumb
This paragraph introduces the concept of determining statistical significance using the range rule of thumb, which involves comparing a given value of a random variable to the mean and standard deviation. It explains that values more than two standard deviations from the mean are considered significantly high or low. The significance is illustrated with a graph, showing the middle range as non-significant and the extremes as significant. The video script also discusses a specific example involving an X-linked genetic disorder, where the random variable is the number of children among five who inherit the disorder. The mean and standard deviation for this example are calculated, and the range rule of thumb is applied to determine the significance of outcomes, such as four or five children inheriting the disorder.
📈 Applying the Range Rule of Thumb to Analyze Genetic Inheritance Outcomes
The second paragraph continues the discussion on the range rule of thumb, focusing on the outcomes of the genetic disorder example. It clarifies the outcomes where no children or all five children inherit the disorder as significantly low and high, respectively. The paragraph also corrects a previous calculation error, emphasizing the correct values for significantly high outcomes. The summary concludes by visually representing the significance levels on a number line, differentiating between significantly high, low, and non-significant outcomes based on the calculated mean and standard deviations.
Mindmap
Keywords
💡Range Rule of Thumb
💡Standard Deviation
💡Mean
💡Significantly High/Low
💡Probability Distribution
💡Genetic Disorder
💡Random Variable
💡Statistical Significance
💡X-linked Genetic Disorder
💡Error Correction
💡Number Line
Highlights
The video discusses learning outcome number four from lesson 5.1, focusing on using the range rule of thumb to determine if a value of a random variable is significantly high or low.
The range rule of thumb states that values more than two standard deviations from the mean are significantly high or low.
Significantly low values are defined as the mean minus two standard deviations or lower.
Significantly high values are defined as the mean plus two standard deviations or higher.
The mean and standard deviation can be calculated using a probability distribution to determine if a value is significantly high or low.
Values within two standard deviations of the mean are not considered significant in a statistical sense.
The choice of two standard deviations from the mean is not rigid and can vary based on the preference of the course or instructor.
A graph is used to visually represent the mean, standard deviations, and the range of significantly high and low values.
The example in the video involves a probability distribution of the number of children among five who inherit an X-linked genetic disorder.
The mean number of children inheriting the disorder was previously calculated to be 2.5.
The standard deviation for this scenario was found to be approximately 1.1 children.
Using the range rule of thumb, the video demonstrates how to determine if outcomes of four or five children inheriting the disorder are significantly high.
Calculations for significantly low values involve subtracting two times the standard deviation from the mean.
Significantly high values are calculated by adding two times the standard deviation to the mean.
The video corrects an error in the calculation of significantly high values, adjusting it to 4.7 instead of 5.7.
Values between 0.3 and 4.7 are not considered significantly high or low in this example.
The video visually demonstrates the range of significantly high and low values on a number line.
Outcomes of zero children or five children inheriting the disorder are considered significantly low and high, respectively.
Any other number of children inheriting the disorder, such as one, two, three, or four, is not statistically significant.
Transcripts
Browse More Related Video

[5.1.16] Using the Range Rule of Thumb to find significant values

5.2.4 Binomial Distributions - Mean, St. Dev., Using Range Rule of Thumb to Find Significant Values
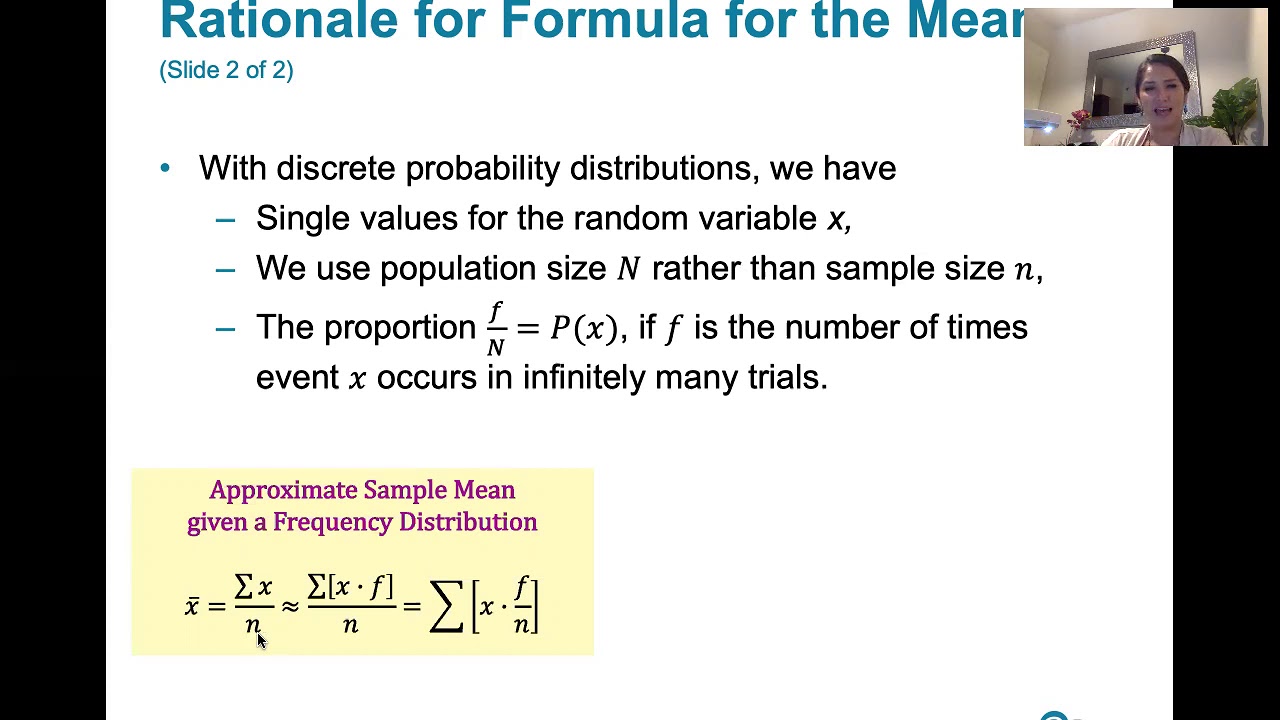
5.1.3 Discrete Probability Distributions - Finding the Mean, Variance, and Standard Deviation
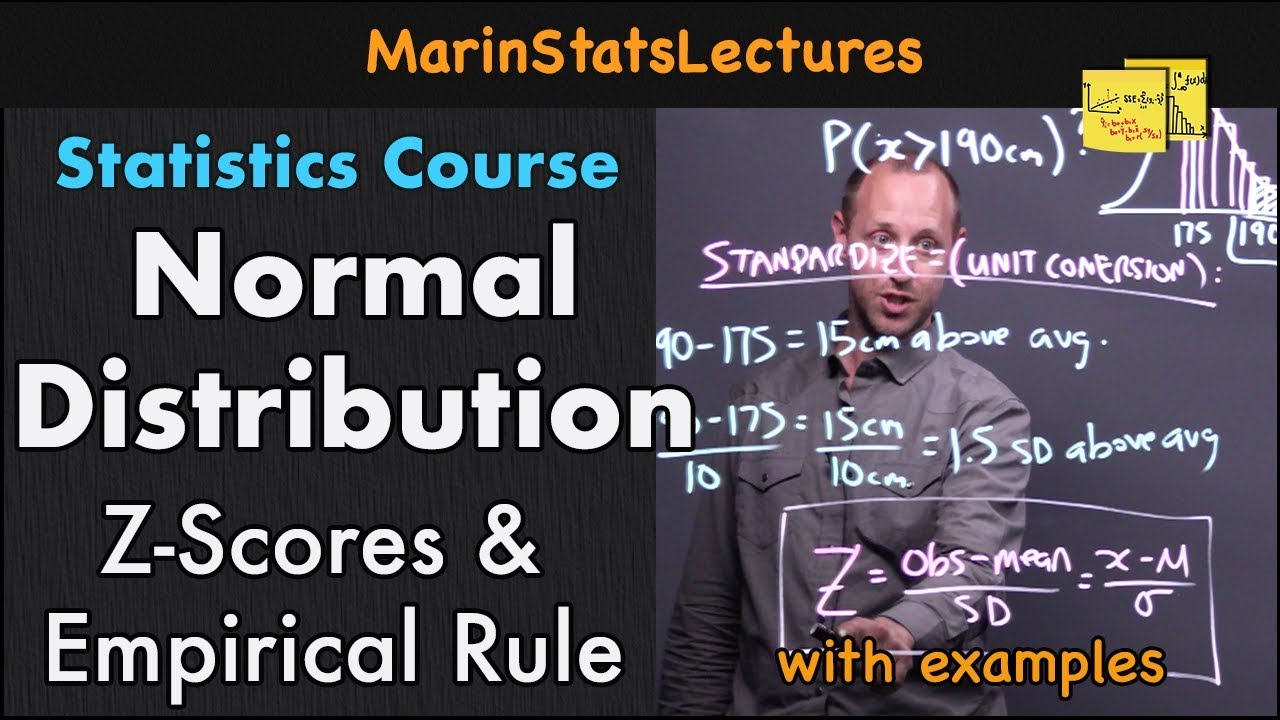
Normal Distribution, Z-Scores & Empirical Rule | Statistics Tutorial #3 | MarinStatsLectures
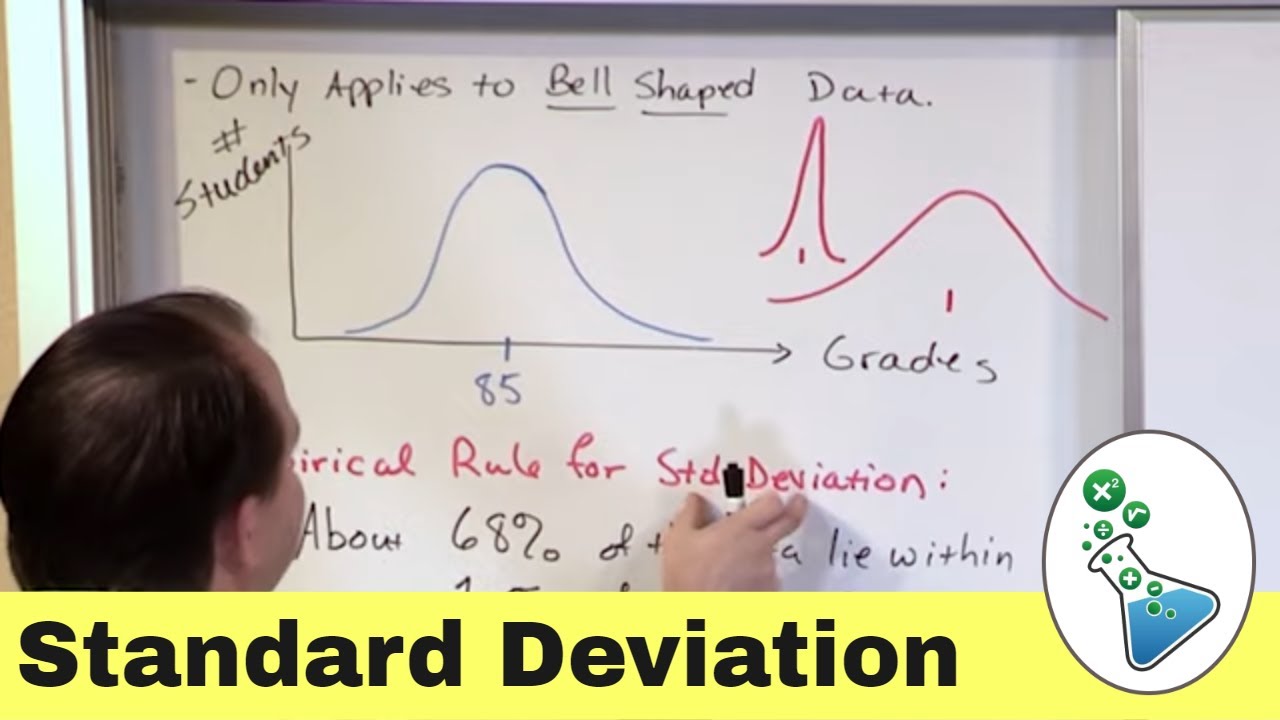
Empirical Rule of Standard Deviation in Statistics

Standard Deviation - Explained and Visualized
5.0 / 5 (0 votes)
Thanks for rating: