[5.1.16] Using the Range Rule of Thumb to find significant values
TLDRIn this video, Professor Curtis from A Spire Mountain Academy teaches how to apply the range rule of thumb to determine significant values in a statistical problem involving the number of girls among 10 children. The professor demonstrates how to calculate the maximum and minimum values using mean and standard deviation from a probability distribution, and concludes that one girl in ten births is significantly low, as it falls below the calculated minimum value. The video encourages viewers to visit A Spire Mountain Academy for more engaging statistics lessons and feedback opportunities.
Takeaways
- 📚 Professor Curtis from A Spire Mountain Academy is offering statistics homework help in this video.
- 📊 The video focuses on using the range rule of thumb to determine significant values in a dataset.
- 👶 The data represents the number of girls among 10 children from different sets of parents.
- 🔢 The random variable X is defined as the number of girls in 10 births.
- 📋 The task involves determining whether one girl in 10 births is a significantly low number.
- 📈 The mean and standard deviation of the distribution are needed for the range rule of thumb calculation.
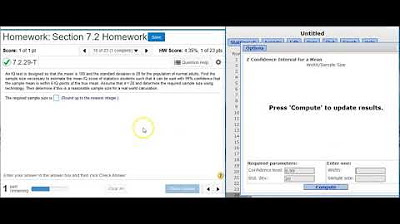
- 🔍 Data is analyzed using StatCrunch, a statistical software, to find the mean and standard deviation.
- 🔢 The percentages in the data are converted to integers by rounding for the calculation.
- ➕ The maximum value is found by adding twice the standard deviation to the mean.
- ➖ The minimum value is calculated by subtracting twice the standard deviation from the mean.
- 🔑 A girl count of one in 10 is considered significantly low if it falls below the calculated minimum value.
- 📝 The conclusion is that one girl in 10 is indeed significantly low based on the range rule of thumb.
Q & A
What is the main topic of the video?
-The main topic of the video is how to use the range rule of thumb to determine significant values in a statistical context, specifically in relation to the number of girls among 10 children.
What is the range rule of thumb used for in this context?
-The range rule of thumb is used to determine whether a particular value, such as the number of girls in 10 births, is significantly low or high compared to the expected distribution.
What is the random variable X in this problem statement?
-In this problem statement, the random variable X represents the number of girls among 10 children.
Why is it necessary to convert percentages to integers in the script?
-It is necessary to convert percentages to integers because the statistical software StatCrunch requires frequency counts in the form of integers for calculating the mean and standard deviation.
How does Professor Curtis round the probabilities to get integer counts?
-Professor Curtis rounds the probabilities by moving the decimal point two places to the right, converting the percentages to a form that can be rounded to the nearest integer.
What statistical software is used in the video?
-The statistical software used in the video is StatCrunch.
What is the mean value obtained from the data in the video?
-The mean value obtained from the data in the video is 5.14.
What is the standard deviation used in the range rule of thumb calculation?
-The standard deviation used in the range rule of thumb calculation is derived from the data and is approximately 1.96 when rounded to two decimal places.
How does the video determine the maximum and minimum values using the range rule of thumb?
-The video determines the maximum value by adding twice the standard deviation to the mean, and the minimum value by subtracting twice the standard deviation from the mean.
What conclusion is drawn in the video regarding the number of one girl in ten births?
-The conclusion drawn in the video is that one girl in ten births is significantly low because it is less than the calculated minimum value using the range rule of thumb.
How can viewers access more help with statistics as mentioned in the video?
-Viewers can access more help with statistics by visiting a spire Mountain Academy's website, where they can learn more about lecture videos and provide feedback on what they'd like to see.
Outlines
📚 Introduction to Range Rule of Thumb
Professor Curtis from A Spire Mountain Academy introduces a statistics homework help segment focused on the range rule of thumb to identify significant values. The problem statement involves analyzing the number of girls among 10 children from different sets of parents. The professor demonstrates how to use the mean and standard deviation from a probability distribution to calculate the maximum and minimum values using StatCrunch software. The aim is to determine if one girl in 10 births is significantly low compared to the calculated range.
🔍 Applying the Range Rule of Thumb to Birth Data
Continuing from the previous explanation, the professor applies the range rule of thumb to the birth data. He converts the probability distribution into integer counts by rounding percentages to the nearest whole number. Using StatCrunch, he calculates the mean and standard deviation of these counts. The professor then uses these values to find the maximum and minimum expected values for the number of girls in 10 births. He concludes that one girl in 10 births is significantly low because it falls below the calculated minimum value, thus providing a clear answer to the problem statement.
Mindmap
Keywords
💡Range Rule of Thumb
💡Significant Values
💡Mean
💡Standard Deviation
💡Statcrunch
💡Probability Distribution
💡Integer Values
💡Minimum Value
💡Maximum Value
💡Significantly Low
💡A Spire Mountain Academy
Highlights
Professor Curtis introduces the range rule of thumb for statistical analysis.
The problem statement involves analyzing the number of girls among 10 children from different sets of parents.
The random variable X is defined as the number of girls in a group of 10 children.
The task is to determine if one girl in 10 births is a significantly low number using the range rule of thumb.
Data is presented in a table and requires analysis using the range rule of thumb.
StatCrunch software is used to facilitate the calculation of mean and standard deviation.
The data must be converted into integers for the software to process it correctly.
Rounding percentages to the nearest integer is a method to convert the data for analysis.
The mean and standard deviation are calculated using StatCrunch with the converted data.
The range rule of thumb is applied by adding and subtracting twice the standard deviation from the mean.
Calculating the maximum value using the range rule of thumb provides an upper limit for expected values.
The minimum value is found by subtracting twice the standard deviation from the mean.
The result is used to determine if one girl in ten is significantly low compared to the calculated range.
A conclusion is drawn that one girl in ten is significantly low if it falls outside the calculated range.
The significance of the number of girls is evaluated against the calculated minimum value.
The video concludes with a call to action for feedback and further learning opportunities at A Spire Mountain Academy.
The video provides a practical application of the range rule of thumb in a real-world scenario.
The importance of correctly inputting data into statistical software is emphasized.
The video offers a step-by-step guide on how to use the range rule of thumb for statistical significance.
Transcripts
Browse More Related Video
Finding and interpreting a confidence interval for a population mean (σ unknown)

5.1.4 Discrete Probability Distributions - The Range Rule of Thumb and Significant Values
Finding degrees of freedom, critical values, and a standard deviation confidence interval estimate
Finding the sample size needed to estimate a confidence interval on a population mean
Finding the best point estimate and confidence interval for proportions
Finding a P-value given the test statistic
5.0 / 5 (0 votes)
Thanks for rating: