Graphing Logarithmic Functions
TLDRThis video script delves into the fundamentals of graphing logarithmic functions, emphasizing their inverse relationship with exponential functions. It outlines the four basic shapes of logarithmic graphs and how they relate to the signs of the variables. The process of graphing is demonstrated through examples, including determining vertical asymptotes and key points. Additionally, the script explains how to find the domain and range of logarithmic functions, highlighting their restrictions and behavior in relation to different values.
Takeaways
- 📈 Logarithmic functions are the inverse of exponential functions, with exponential functions having a horizontal asymptote and logarithmic functions having a vertical one.
- 📊 The basic curve of a logarithmic function like log(x) travels towards quadrant one where both x and y are positive.
- 🔄 The graph of a logarithmic function with a negative inside, such as -log(x), reflects across the y-axis towards quadrant two where x is negative and y is positive.
- 🔄 If the negative sign is in front of the logarithm, such as log(-x), the graph reflects over the x-axis towards quadrant three where x is positive and y is negative.
- 🌐 When both x and y are negative, the graph reflects relative to the origin, occurring in quadrant three.
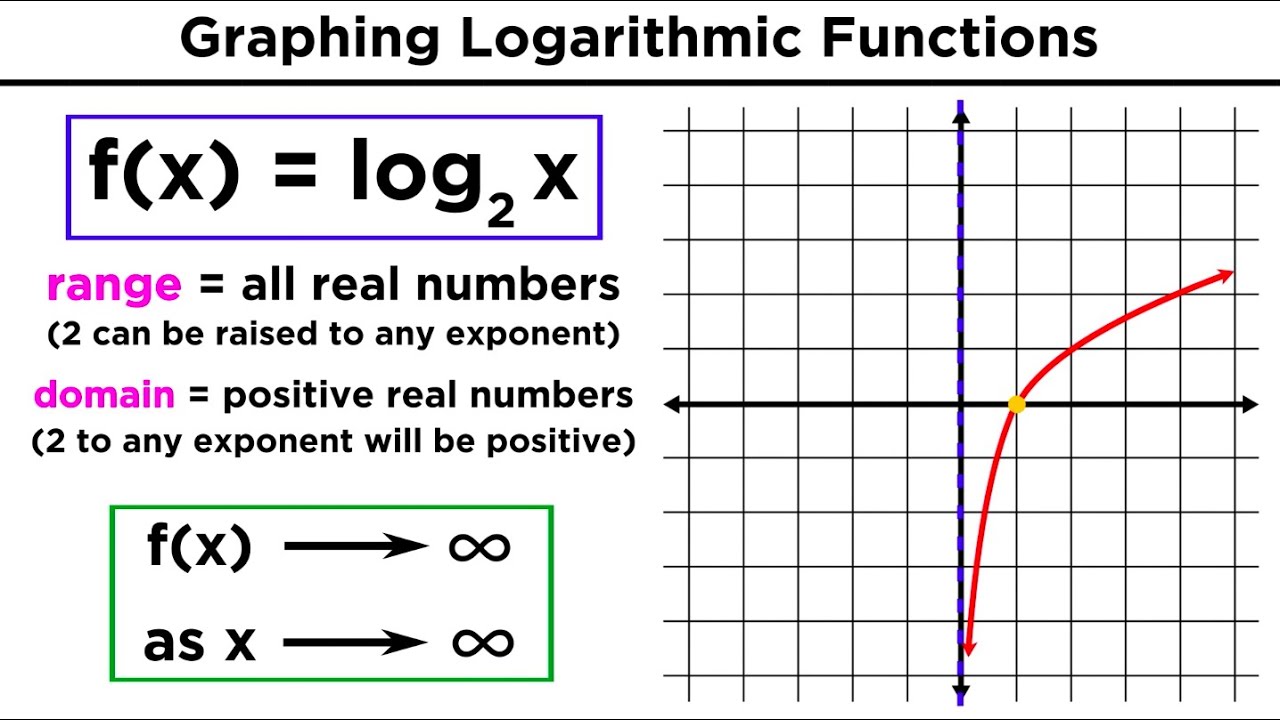
- 📌 To graph a logarithmic function, set x to key values like zero (for the vertical asymptote), one, and the base of the logarithm.
- 📈 The range of logarithmic functions is all real numbers from negative infinity to infinity, whereas the domain is from zero to infinity, not including zero.
- 🔍 The signs in front of x and y in a logarithmic function can help determine the direction of the graph relative to the quadrants.
- 📊 For a transformed logarithmic function, such as log base b (x - h) + k, find the values of x that create the vertical asymptote and the key points for the graph.
- 📈 To graph a transformed logarithmic function, start from the vertical asymptote and follow the key points to create the curve.
- 🌟 Always begin graphing from the asymptote and use the points to guide the curve; this ensures accuracy in the graph's representation.
Q & A
What are the four basic shapes of logarithmic functions discussed in the transcript?
-The four basic shapes are: 1) log x with x and y positive, which travels towards quadrant one; 2) log(-x) with x negative and y positive, reflecting across the y-axis towards quadrant two; 3) -log x with x positive and y negative, reflecting across the x-axis towards quadrant three; and 4) -log(-x) with both x and y negative, reflecting across the origin relative to the original function.
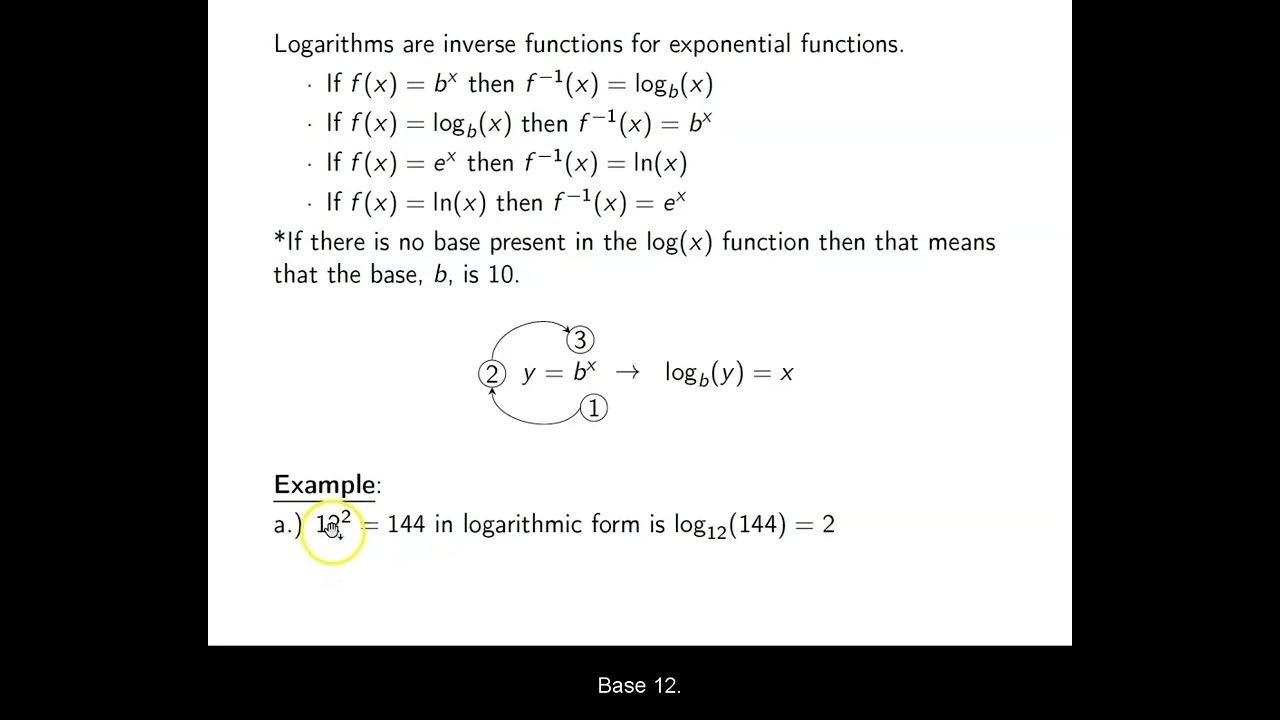
How do logarithmic functions relate to exponential functions?
-Logarithmic functions are the inverse of exponential functions. This means that if you have an exponential function like 2 to the power of x, its inverse would be the logarithmic function log base 2 of x. They are reflections of each other across the line y equals x.
What is a vertical asymptote in logarithmic functions?
-A vertical asymptote in logarithmic functions occurs at the point where the value inside the logarithm (the argument) is zero. For example, in the function log base two of x, the vertical asymptote is at x equals zero, which is the y-axis.
What is the domain of a logarithmic function?
-The domain of a logarithmic function is all positive real numbers, from zero to infinity, because the argument of the logarithm (the value inside the log function) must be greater than zero. In mathematical notation, the domain is (0, ∞).
What is the range of a logarithmic function?
-The range of a logarithmic function is all real numbers, from negative infinity to infinity. This is because the output of a logarithmic function can take on any real number value as the input increases or decreases. In mathematical notation, the range is (-∞, ∞).
How do you find the graph of log base two of x?
-To graph log base two of x, first identify the vertical asymptote at x equals zero (the y-axis). Then, find the x-intercept by setting the function equal to zero and solving for x. Finally, plot the function's behavior based on its increasing or decreasing nature, starting from the asymptote and following the curve through positive values.
What happens when you combine logarithmic and linear transformations in a function like log base three of (x - 1) + 2?
-When you combine logarithmic and linear transformations, you shift and modify the basic logarithmic shape. For log base three of (x - 1) + 2, the graph will have a vertical shift to the right by 1 unit (due to the (x - 1) part) and a vertical shift upwards by 2 units (due to the +2). The vertical asymptote will be at x equals 1, and the graph will pass through the points (2, 2) and (4, 3).
How do you determine the direction in which a graph of a logarithmic function with negative signs in front of x and y will travel?
-The direction of the graph is determined by the signs in front of x and y. If x is negative, the graph will go towards the left (since negative x corresponds to the second and third quadrants). If the logarithm (associated with y) is negative, the graph will go downwards. So, a negative sign in front of the logarithm indicates a downward slope in the graph.
What is the process for graphing the function three minus log base four of (five - x)?
-To graph three minus log base four of (five - x), first find the vertical asymptote by setting the inside of the log function (five - x) equal to the base (four), which gives x equals five. Then, find the x-values by setting the inside of the log function to one (which gives x equals four) and setting it to zero (which is not possible since the log of zero is undefined). The graph starts at the vertical asymptote x equals five, and follows the points (1, 2) and (4, 3).
How can you quickly determine the direction of a logarithmic function's graph without plotting points?
-You can quickly determine the direction of a logarithmic function's graph by looking at the signs in front of x and y. If x is negative, the graph will travel towards the left (quadrant two or three). If y is negative, the graph will travel downwards. The combination of these signs will give you a general idea of the direction the graph will take without the need to plot specific points.
What is the significance of the base of a logarithmic function in determining the steepness of the graph?
-The base of a logarithmic function affects the steepness of the graph. A larger base means a steeper graph, as the function will increase or decrease more rapidly. Conversely, a base between 0 and 1 results in a graph that is flatter, as the function's rate of change is slower. This is because a larger base indicates a more sensitive response to changes in x, leading to quicker changes in y.
Outlines
📊 Introduction to Graphing Logarithmic Functions
This paragraph introduces the concept of graphing logarithmic functions, emphasizing the four basic shapes they can take. It begins by discussing the graph of log x, where x and y are positive, and how it travels towards quadrant one. The inverse relationship between logarithmic and exponential functions is highlighted, with the latter having a horizontal asymptote and the former a vertical one. The rate of increase for exponential functions versus the rate of decrease for logarithmic functions is also compared. The paragraph then provides a step-by-step guide on how to graph log base two of x, including finding the vertical asymptote and key points, and discusses the domain and range of logarithmic functions, noting their restrictions.
📈 Graphing Logarithmic Functions with Transformations
This section delves into the specifics of graphing logarithmic functions with transformations. It starts by illustrating how to graph log base three of (x - 1) + 2, explaining the process of finding the vertical asymptote and key points. The paragraph then discusses the domain and range of the function, reiterating that the range is all real numbers from negative infinity to infinity, and the domain is from one to infinity, considering the vertical asymptote. The explanation includes a method for determining the function's behavior by examining the signs of x and y, and concludes with a practical example of graphing the function using the identified points and asymptote.
📉 Advanced Graphing Techniques for Logarithmic Functions
The final paragraph focuses on advanced graphing techniques for logarithmic functions, particularly those with negative signs in front of x and y. It explains how the graph of three minus log base four of (five - x) behaves, including the identification of the vertical asymptote and the necessary x values. The paragraph emphasizes the importance of starting the graph from the vertical asymptote and following the key points to accurately plot the function. It also touches on the direction the graph will take based on the signs of the function and provides a practical example of how the graph will appear, noting that it will eventually travel towards quadrant three but at a slower pace.
Mindmap
Keywords
💡Graphing
💡Logarithmic Functions
💡Exponential Functions
💡Asymptote
💡Inverse Functions
💡Quadrants
💡Domain
💡Range
💡Transformations
💡Vertical Asymptote
Highlights
Graphing logarithmic functions and their four basic shapes were discussed.
Logarithmic functions are inverses of exponential functions.
Exponential functions have a horizontal asymptote, while logarithmic functions have a vertical asymptote.
Logarithmic functions increase at a decreasing rate, unlike exponential functions which increase at an increasing rate.
Graph of log(x) travels towards quadrant one where both x and y are positive.
The graph of log(-x) reflects across the y-axis, going towards quadrant two where x is negative and y is positive.
For negative log(positive x), the graph reflects over the x-axis, traveling towards quadrant three where x is positive and y is negative.
When both x and y are negative, the graph reflects relative to the origin in quadrant three.
The process of graphing log base two of x was explained, starting with the vertical asymptote at x equals zero.
The range of logarithmic functions is all real numbers from negative infinity to infinity.
The domain of logarithmic functions is from zero to infinity, not including zero as it is the vertical asymptote.
An example of graphing log base three of (x - 1) + 2 was provided, with steps to find the vertical asymptote and key points.
The domain and range of the function log base three of (x - 1) + 2 was identified as one to infinity and all real numbers respectively.
Another example was given with three minus log base four of (five - x), detailing how to find the vertical asymptote and points for graphing.
The graph of three minus log base four of (five - x) was shown to eventually travel towards quadrant three.
The signs in front of x and y in logarithmic functions can be used to determine the direction of the graph's travel.
Always start graphing from the vertical asymptote and follow the key points to accurately plot the function.
Transcripts
Browse More Related Video
Logarithms Part 1: Evaluation of Logs and Graphing Logarithmic Functions
Ch. 4.3 Logarithmic Functions
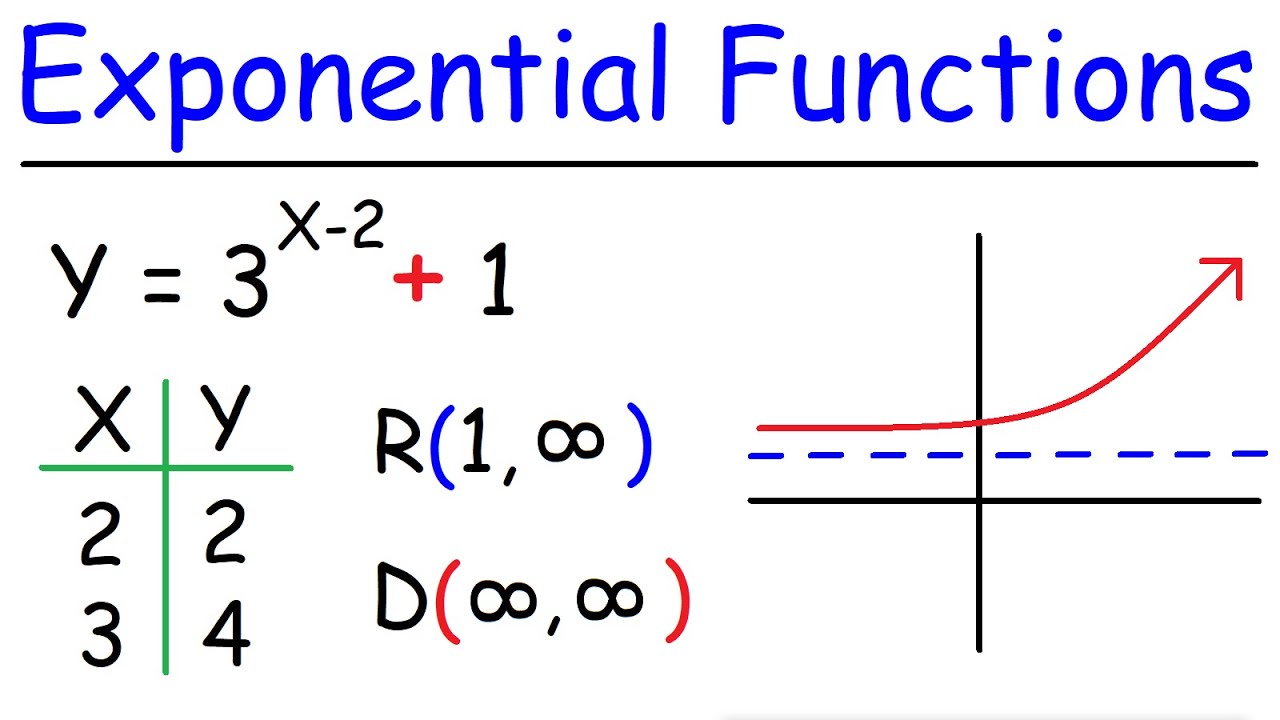
How To Graph Exponential Functions
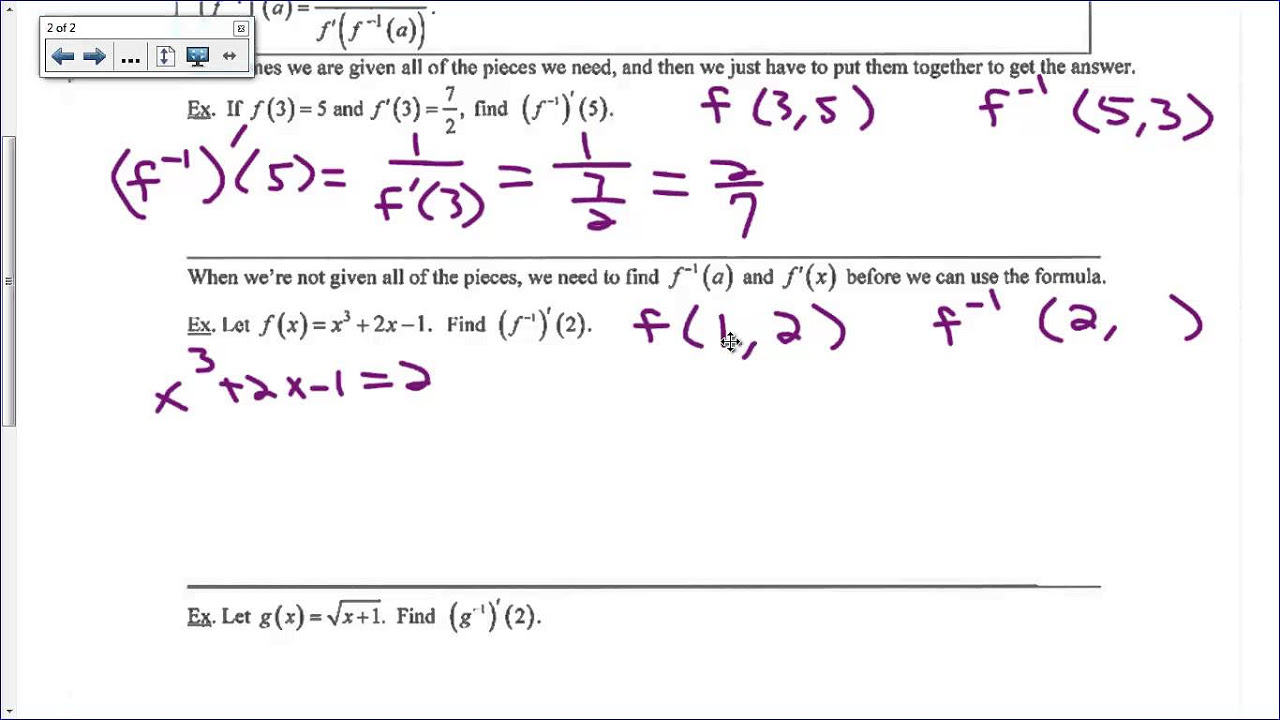
Derivatives of Inverse Functions
Graphing Advanced Rational Functions With Asymptotes and Holes Using Transformations
How To Graph Equations - Linear, Quadratic, Cubic, Radical, & Rational Functions
5.0 / 5 (0 votes)
Thanks for rating: