How to Sketch Polynomial Functions (Precalculus - College Algebra 31)
TLDRThe video script is an educational guide on sketching polynomial functions, focusing on understanding the behavior of polynomials through their factored form. It emphasizes the importance of identifying the leading term to determine the degree of the polynomial, the maximum number of turning points, and the end behavior of the graph. The transcript walks through the process of finding y-intercepts and x-intercepts, including the use of the zero product property and the concept of multiplicity. It also explains how to interpret the behavior at x-intercepts as either a bounce (even multiplicity) or a cross (odd multiplicity). The script provides a step-by-step approach to graphing polynomials, starting with simple examples and gradually increasing complexity, highlighting the need for accuracy in factoring polynomials before attempting to graph them. It also touches on the application of these concepts in calculus, particularly in finding turning points and analyzing local maxima and minima. The summary aims to demystify the graphing process and prepare students for more advanced mathematical studies.
Takeaways
- 📈 Understanding the leading term of a polynomial is crucial as it provides information about the degree, maximum turning points, and end behavior of the graph.
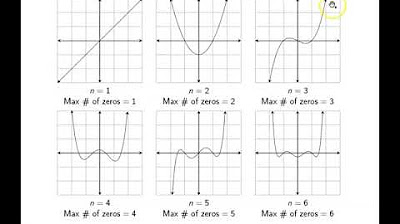
- 🔍 The degree of a polynomial is the highest power of the variable, which dictates the maximum number of turning points the graph can have.
- 🔢 The end behavior of a polynomial is determined by the power function derived from the leading term, which can either open upwards or downwards based on the sign of the leading coefficient.
- ✅ To find the y-intercept without distributing the polynomial, simply evaluate the polynomial at x = 0.
- 🔍 X-intercepts are found by setting each factor with a variable equal to zero and solving for the variable, using the zero product property.
- 🛑 An irreducible quadratic factor does not yield real x-intercepts but may represent a turning point on the graph.
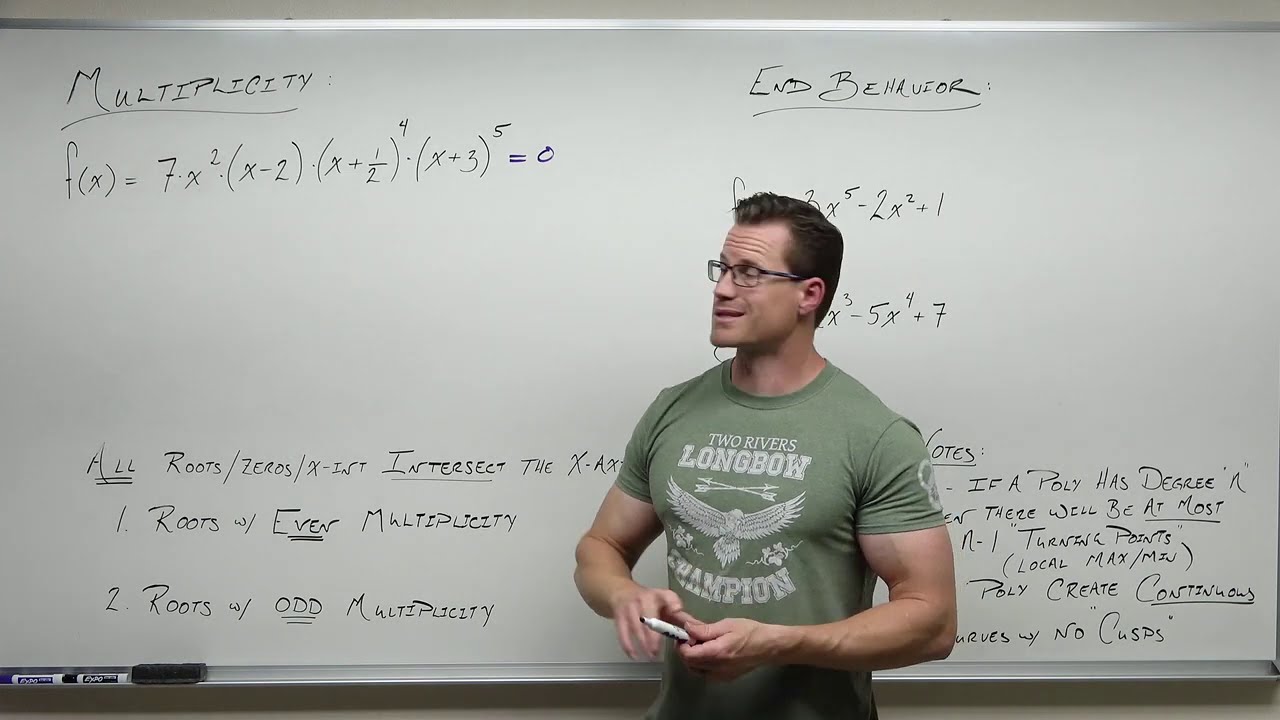
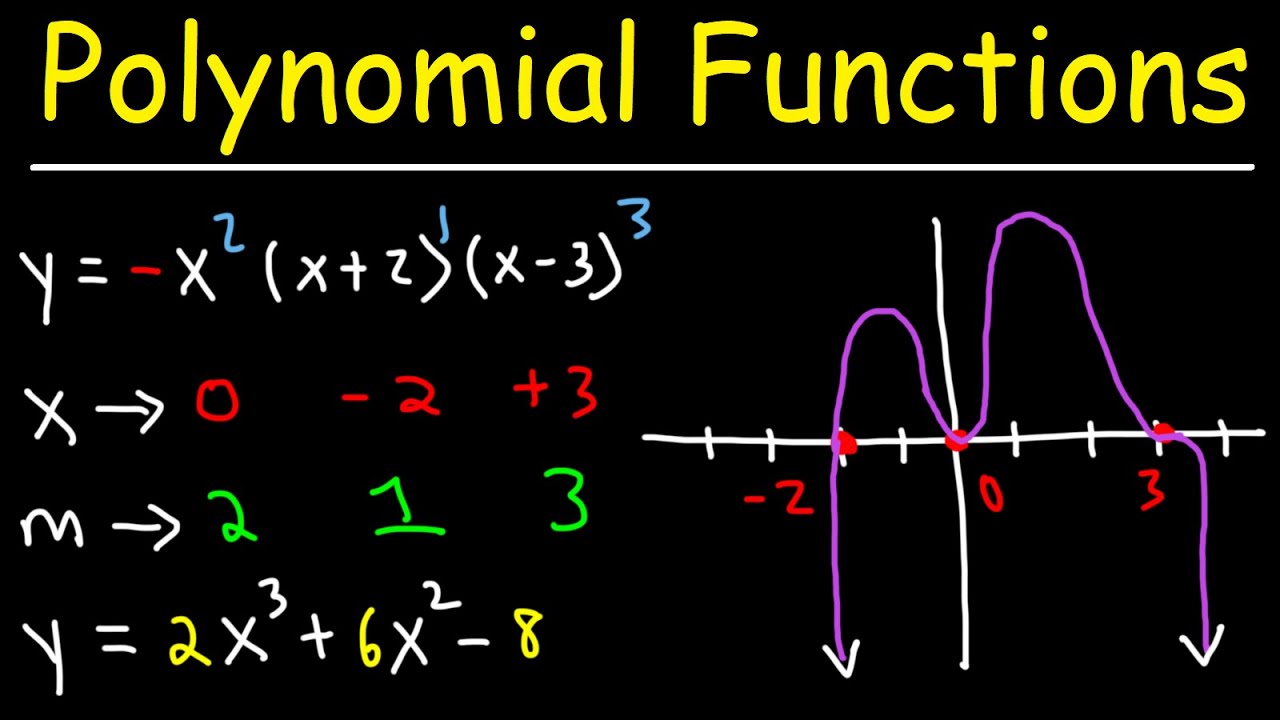
- 🔄 Multiplicity of a factor affects how the graph behaves at the x-intercept; even multiplicity causes the graph to touch or bounce off the x-axis, while odd multiplicity results in a crossing.
- 📊 Sketching a polynomial graph involves plotting the y-intercept, x-intercepts with their multiplicities, and considering the end behavior to draw the overall shape of the graph.
- ⚙️ For a more precise graph, plug in values between x-intercepts to find additional points that can refine the graph's shape.
- 📐 The graph must follow the rules of end behavior, y-intercept, x-intercepts, and turning points to be accurate.
- 📚 Factoring polynomials is essential before sketching their graphs, and it's important to factor completely to ensure all x-intercepts are identified.
Q & A
What is the primary focus of the video?
-The video focuses on sketching polynomials by understanding their end behavior, maximum turning points, degree, y-intercepts, x-intercepts, and multiplicities.
Why is it important to find the leading term of a factored polynomial?
-The leading term provides crucial information about the polynomial's degree, maximum number of turning points, and end behavior, which are essential for graphing the polynomial.
How does the degree of a polynomial relate to its maximum number of turning points?
-The maximum number of turning points of a polynomial is one less than its degree. This is because the degree represents the highest power of the variable in the polynomial.
What is the significance of the multiplicity of an x-intercept?
-The multiplicity of an x-intercept determines whether the graph of the polynomial will 'touch' or 'bounce' at the x-intercept (even multiplicity) or 'cross' the x-axis (odd multiplicity).
How can you find the y-intercept of a polynomial without fully distributing the polynomial?
-You can find the y-intercept by evaluating the polynomial at x = 0, which gives the constant term of the polynomial without the need for full distribution.
What is the zero product property used for in the context of finding x-intercepts?
-The zero product property is used to set each factor with a variable equal to zero, which helps in solving for the x-intercepts of the polynomial.
Why is it recommended not to fully distribute a factored polynomial unless required?
-Fully distributing a factored polynomial can be time-consuming and error-prone, especially for higher degrees. It is sufficient to find the leading term and use it to determine the polynomial's characteristics for sketching the graph.
How does the end behavior of a polynomial graph relate to its leading term?
-The end behavior of a polynomial graph is determined by the power function that results from the leading term. If the power is even, the graph will eventually point in the same direction (up or down) as x approaches infinity or negative infinity. If the power is odd, the graph will point in the opposite direction.
What is the term used to describe the process of estimating the graph of a polynomial?
-The process is called 'sketching,' which involves estimating the graph's general shape and features without calculating precise points or using calculus.
Why is it necessary to ensure that a polynomial is fully factored before attempting to sketch its graph?
-A fully factored polynomial allows for easier identification of x-intercepts and their multiplicities, which are essential for accurately sketching the graph. It also helps in determining the polynomial's end behavior and turning points.
How does the video script guide viewers in sketching a polynomial graph?
-The script provides a step-by-step process that includes finding the leading term, degree, maximum turning points, end behavior, y-intercept, x-intercepts, and their multiplicities. It also discusses the importance of checking that all elements of the graph work together to form a consistent sketch.
Outlines
📚 Introduction to Polynomial Sketching
The video begins with an introduction to sketching polynomials by combining concepts learned in previous videos. The focus is on end behavior, maximum turning points, y-intercepts, x-intercepts, and their multiplicities. The importance of understanding these concepts is emphasized, especially in relation to rational sketching and further studies in calculus. The process involves identifying leading terms, degree, end behavior, y-intercepts, and x-intercepts without fully distributing the polynomial. The video also mentions the need for a derivative to find turning points in calculus.
🔍 Finding the Leading Term and Degree
The leading term of a factored polynomial is identified by multiplying the largest powers of the variable x from each factor, including the coefficient. This term provides crucial information about the polynomial's degree and the maximum number of turning points. The degree is the highest power of x, and the maximum turning points are one less than the degree. The leading term also dictates the end behavior of the graph, which is determined by the power function derived from it.
📈 Sketching the Polynomial Graph
The process of finding x-intercepts involves setting each factor with a variable equal to zero and solving, using the zero product property. Coefficients do not affect x-intercepts. The video explains how to determine the multiplicity of each x-intercept from the exponent of the corresponding factor. Even multiplicities result in a touch or bounce at the x-intercept, while odd multiplicities cause the graph to cross the x-axis. The video also discusses the irreducible quadratic and its impact on turning points rather than x-intercepts.
🤔 Understanding Multiplicity and Graph Dynamics
The video emphasizes the concept of multiplicity at x-intercepts and its impact on the graph's behavior. An even multiplicity results in a bounce or touch, while an odd multiplicity leads to a cross. The importance of ensuring that all aspects of the graph, such as end behavior, y-intercept, and x-intercepts, work together cohesively is highlighted. If there is a discrepancy, it indicates an error in the sketching process.
📉 Sketching a Cubic Polynomial Example
The video walks through an example of sketching a cubic polynomial. It demonstrates finding the leading term, degree, end behavior, y-intercept, and x-intercepts. The process includes using a dotted line to indicate a bounce at an x-intercept with even multiplicity and ensuring that the graph's direction changes align with the maximum turning points. The example serves to illustrate the sketching process for a relatively simple polynomial.
🔢 Factoring and Sketching with X-Intercepts
The video continues with an example that requires factoring before sketching. It details the process of finding the leading term, y-intercept, and x-intercepts with their respective multiplicities. The sketching process involves ensuring that the graph's behavior matches the end behavior, y-intercept, and x-intercepts, including the correct interpretation of bounces and crosses based on multiplicity. The video also provides a technique for factoring polynomials to avoid sign errors.
📌 Pinpointing X-Intercepts and Graphing
The video emphasizes the importance of factoring polynomials completely before attempting to sketch the graph. It explains that unfactored quadratics within a polynomial do not contribute to x-intercepts but may indicate turning points. The process of setting factors equal to zero to find x-intercepts is demonstrated, along with determining their multiplicities and the corresponding behavior at those points on the graph. The video also discusses the impact of the leading term's coefficient on the graph's stretch or compression.
🤓 Sketching with Consideration of All Factors
The video concludes with a reminder to consider all factors of the polynomial when sketching, ensuring that the graph's end behavior, y-intercept, and x-intercepts are accurately represented. It also suggests plugging in values between x-intercepts for a more precise graph, although this step is not always necessary for a basic sketch. The video outlines how to adjust the graph's scale to accommodate the graph's dynamics and emphasizes the importance of accuracy in the sketching process.
Mindmap
Keywords
💡Polynomial Sketching
💡End Behavior
💡Y-Intercept
💡X-Intercepts
💡Multiplicity
💡Leading Term
💡Factoring Polynomials
💡Turning Points
💡Irreducible Quadratics
💡Degree of a Polynomial
💡Zero Product Property
Highlights
The video covers a comprehensive approach to sketching polynomials, combining concepts like end behavior, maximum turning points, degree, and y-intercepts.
It emphasizes the importance of understanding multiplicity in relation to x-intercepts and how they affect the graph of a polynomial.
The presenter explains that sketching polynomials is crucial for rational sketching and further calculus studies, particularly in finding turning points.
The video demonstrates how to identify the leading term of a factored polynomial without fully distributing it, which is essential for graphing.
The degree of a polynomial determines the maximum number of turning points possible, with the graph having at most one less turning point than the degree.
The leading term dictates the end behavior of the graph, which is either upward or downward opening depending on whether the leading term's coefficient is positive or negative.
The y-intercept can be found by evaluating the polynomial at x = 0, without the need for full distribution.
X-intercepts are determined by setting each factor with a variable equal to zero and solving, utilizing the zero product property.
The multiplicity of an x-intercept, derived from the exponent of the factor, indicates whether the graph will bounce or cross at that point.
The video provides a technique for sketching polynomials by first plotting y-intercepts and x-intercepts, then considering the end behavior and multiplicity.
It is noted that the graph must reflect the end behavior, the number of turning points, and the y-intercept accurately for a correct sketch.
The presenter uses a 'dotted line' technique to indicate bounces at x-intercepts with even multiplicity, helping to avoid incorrect crossings.
The video includes a step-by-step example of sketching a polynomial graph, integrating all the discussed concepts.
For a more precise graph, the presenter suggests plugging in values between x-intercepts to understand the graph's dynamic behavior.
The video concludes with the presenter assuring viewers that understanding these graphing techniques will make calculus studies easier.
The presenter hints at future videos covering real zeros, factoring polynomials, and the application of calculus to refine graphing techniques.
Transcripts
Browse More Related Video
Multiplicity and End Behavior of Polynomials (Precalculus - College Algebra 29)
How To Graph Polynomial Functions Using End Behavior, Multiplicity & Zeros
Creating Polynomials from Real Zeros (Precalculus - College Algebra 30)
Ch. 3.2 Polynomial Functions and their Graphs
Graphing Higher-Degree Polynomials: The Leading Coefficient Test and Finding Zeros

Graphing Rational Functions (Precalculus - College Algebra 44)
5.0 / 5 (0 votes)
Thanks for rating: