Physics | Vertical Projectile Motion | Graphs
TLDRThis educational video script delves into the intricacies of projectile motion graphs, a pivotal topic for physics examinations. The instructor introduces three distinct scenarios to illustrate the concepts: dropping an object, throwing a ball vertically upwards, and analyzing a bouncing ball's motion. Each scenario is meticulously dissected to demonstrate how velocity, displacement, and acceleration graphs are constructed and interpreted. The script emphasizes the importance of labeling, choosing a positive direction, and understanding the mathematical implications of gradients and areas under the graphs. The instructor promises future lessons on applying these concepts to solve past exam questions, encouraging viewers to subscribe for more informative content.
Takeaways
- 📉 Understanding projectile motion graphs is crucial for exams like IEB or NSNCS.
- 📢 Make sure to subscribe to the channel for more lessons.
- 📊 Always label your graphs properly, indicating units for velocity (meters per second) and time (seconds).
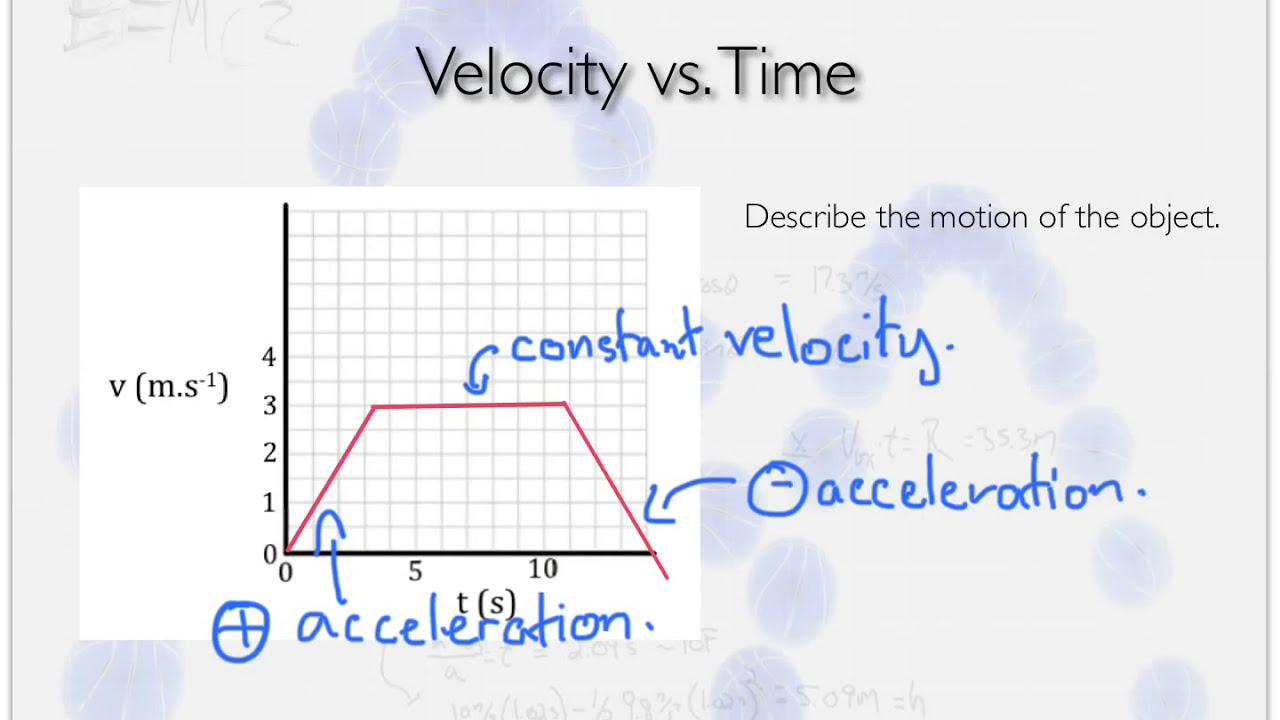
- 📈 For a falling object, if down is considered positive, the velocity-time graph starts at zero and increases linearly.
- 🔄 If up is considered positive, the velocity-time graph starts at zero and decreases linearly, showing negative values.
- 🟰 The gradient of a velocity-time graph represents acceleration, specifically gravitational acceleration (9.8 m/s²).
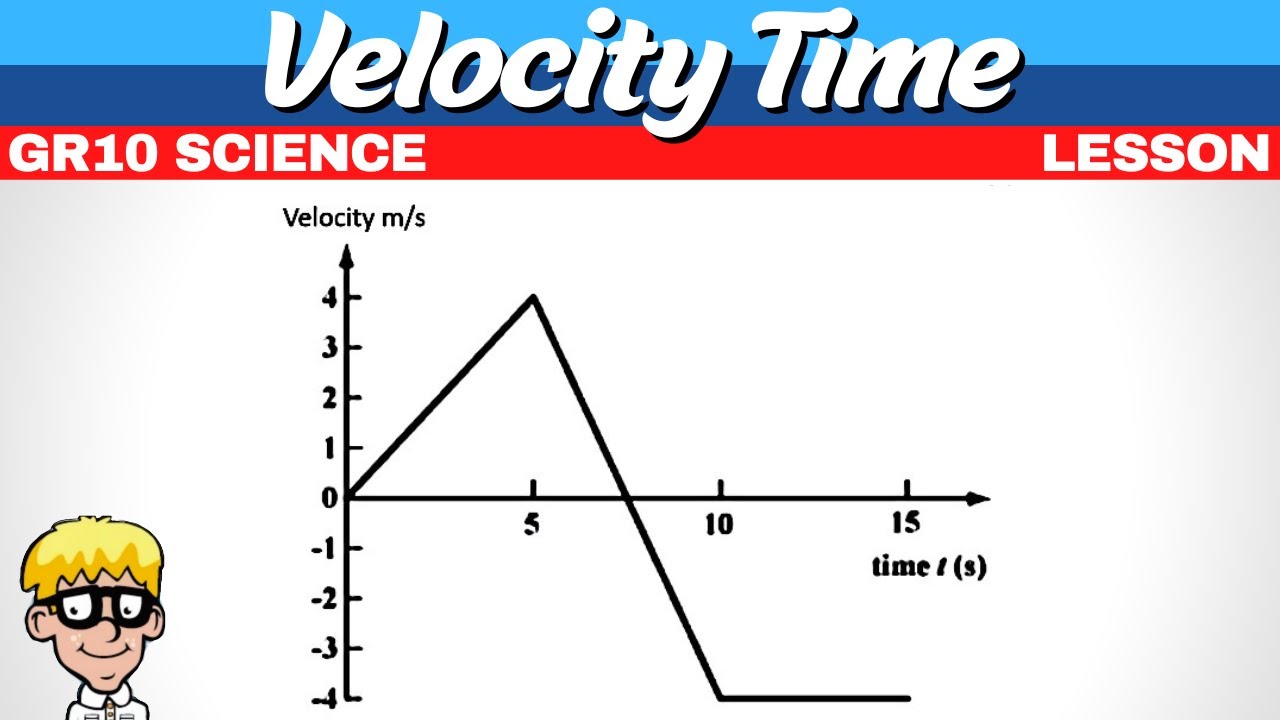
- 🔄 When throwing an object upwards, the velocity-time graph starts at the initial velocity, decreases to zero at maximum height, then becomes negative as it falls.
- 🟢 The area under a velocity-time graph indicates displacement.
- 🏞️ For a position-time graph, taking the ground as zero, the graph starts at the object's initial height and decreases to zero when it hits the ground.
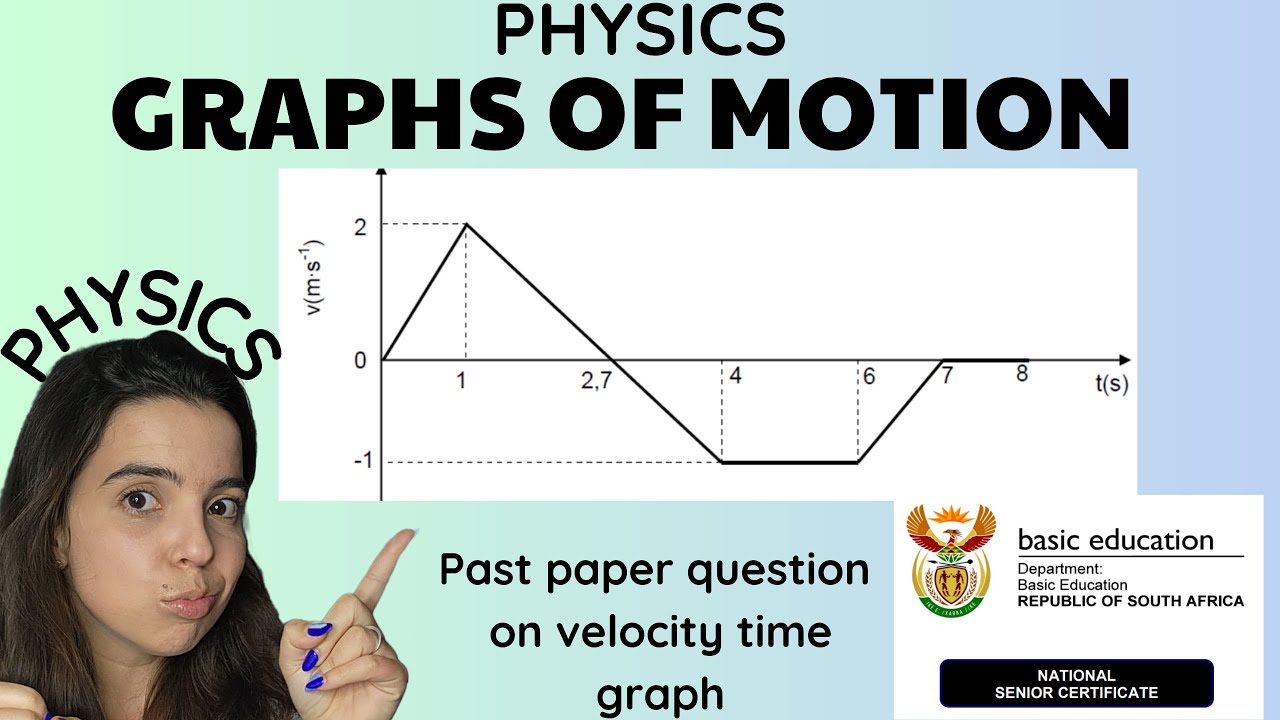
- 🛤️ For a bouncing ball, the velocity-time graph shows a rapid change in direction at the bounce, indicating a large force acting upwards briefly.
- 🚀 Acceleration-time graphs for free fall remain constant at -9.8 m/s² unless the object experiences a force during events like bouncing.
Q & A
What are projectile motion graphs and why are they important for exams?
-Projectile motion graphs are visual representations of the motion of an object under the influence of gravity, typically involving velocity and displacement over time. They are important for exams like IEB or NSNCS as they help in understanding and analyzing the behavior of projectiles, which is a fundamental concept in physics.
What is the first type of graph discussed in the script and what does it represent?
-The first type of graph discussed is the velocity-time graph. It represents the velocity of an object over time, showing how the velocity changes as time progresses, which is crucial for analyzing projectile motion.
How does the velocity of an object change when it is dropped from a building?
-When an object is dropped from a building, its velocity increases continuously until it reaches the ground due to the acceleration caused by gravity. The initial velocity is zero, and it accelerates in the downward direction.
What is the significance of labeling a velocity-time graph and what should be considered?
-Labeling a velocity-time graph is important for clarity and understanding. One should consider labeling the axes with appropriate units (velocity in meters per second and time in seconds), and also decide on the positive direction (up or down) for the sake of consistency in the graph.
Why is the velocity-time graph for a falling object a straight line?
-The velocity-time graph for a falling object is a straight line because the object experiences a constant acceleration due to gravity. This results in a linear increase in velocity with time, hence the graph appears as a straight line.
What does the gradient of the velocity-time graph represent and what is its value?
-The gradient of the velocity-time graph represents the acceleration due to gravity. Its value is 9.8 m/s², which is the acceleration experienced by an object in free fall under the influence of Earth's gravity.
How does the velocity-time graph change if 'up' is considered as the positive direction?
-If 'up' is considered as the positive direction, the velocity-time graph for an object falling down would be a reflection of the graph around the time axis, showing negative velocities as the object moves in the downward direction.
What is the scenario described for the second graph in the script and how does it differ from the first?
-The second scenario involves throwing a ball vertically upwards, which reaches a maximum height before falling back down. This differs from the first scenario (dropping an object) as the object has an initial upward velocity that decreases until it reaches the maximum height, then the velocity becomes negative as it falls back down.
How does the area under the velocity-time graph relate to displacement?
-The area under the velocity-time graph represents the total displacement of the object. This is because the area under the graph (calculated as 0.5 * base * height for a triangular area) gives the distance traveled by the object in the direction of the positive velocity.
What is the shape of the position-time graph for a projectile motion and why?
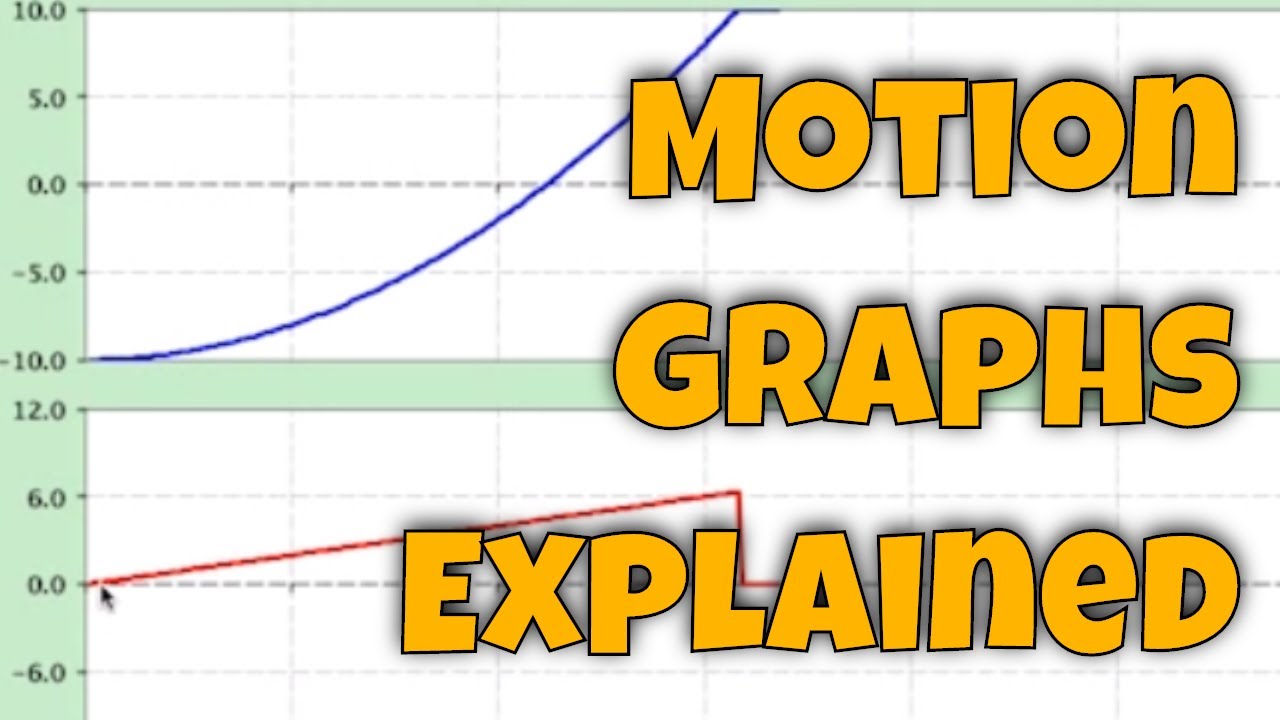
-The position-time graph for projectile motion is typically a parabola. This is because the vertical displacement of the object over time, when considering only the vertical component of motion, follows a quadratic relationship due to the constant acceleration of gravity.
What is the acceleration-time graph for a projectile motion and why does it remain constant?
-The acceleration-time graph for projectile motion is a straight horizontal line at -9.8 m/s² if 'up' is considered positive. It remains constant because the only acceleration acting on the object is due to gravity, which is constant and does not change with time.
How does the bouncing ball scenario affect the velocity-time graph?
-In the bouncing ball scenario, the velocity-time graph shows a sudden change in velocity when the ball hits the ground. There's a brief moment where the velocity changes direction from negative (moving downwards) to positive (moving upwards) due to the force exerted by the ground, which is much greater than gravity for a short period.
What does the position-time graph look like for a bouncing ball scenario?
-The position-time graph for a bouncing ball scenario still follows a parabolic shape. However, it will show multiple 'bounces' as the ball reaches maximum heights and then descends, with each bounce being lower than the previous one if energy is lost during each collision.
Outlines
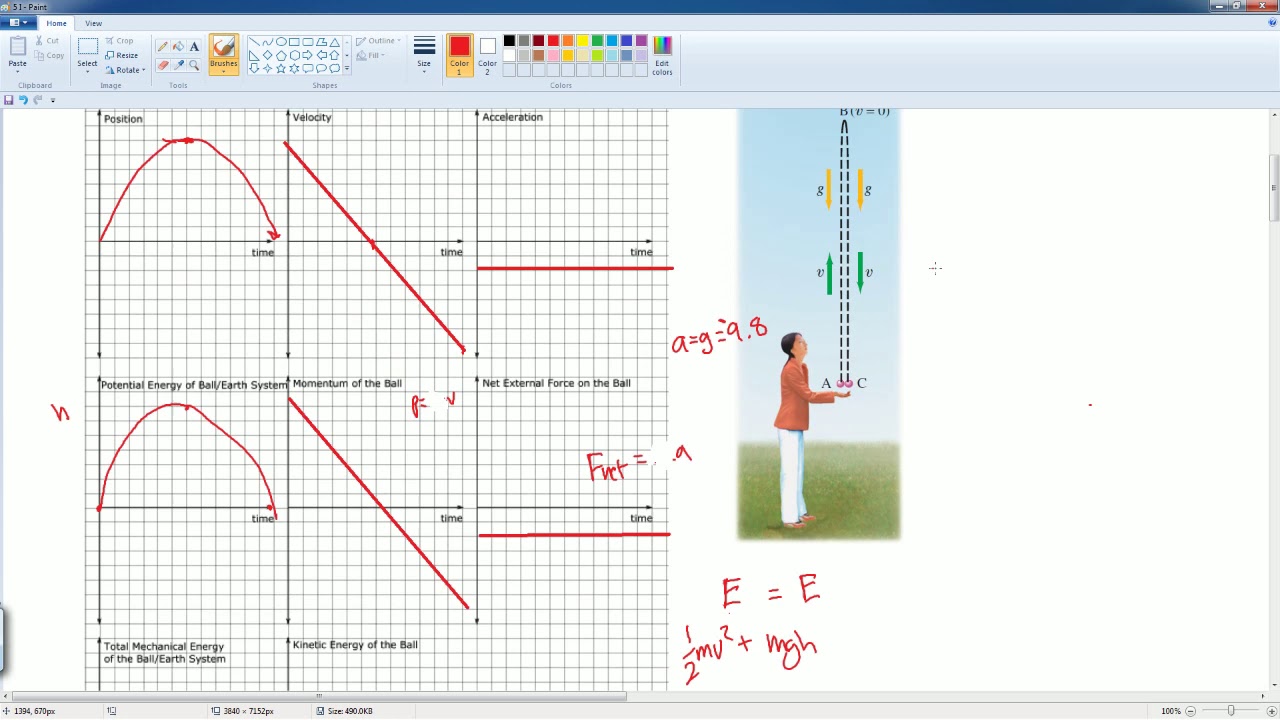
📚 Introduction to Projectile Motion Graphs
The video begins with an introduction to projectile motion graphs, emphasizing their importance for various exams. The instructor encourages viewers to subscribe to the channel for more lessons and to engage by liking the video. The focus then shifts to the first type of graph to be discussed: the velocity-time graph. The instructor sets up the context by describing a scenario of dropping an object from a building, explaining that the velocity will increase until impact and starts at an initial velocity of zero. The importance of labeling the graph is highlighted, with velocity on the y-axis and time on the x-axis. The instructor then explains that the graph for this scenario would be a straight line with a positive slope, indicating increasing velocity over time.
📈 Understanding Velocity-Time Graphs for Dropping and Throwing Scenarios
This paragraph delves deeper into the specifics of velocity-time graphs for different scenarios. The instructor first discusses the case of an object being dropped, noting that the graph would start at zero velocity and increase linearly due to the constant acceleration of gravity. The direction of positive velocity is chosen to be downwards, resulting in a positive slope. The instructor also explains the implications of choosing 'up' as the positive direction, which would result in a negative slope. The paragraph continues with a scenario of throwing a ball vertically upwards, where the velocity starts positive, decreases to zero at the peak, and then becomes negative as the ball falls back down. The instructor illustrates how the graph would reflect this motion, with a line that starts positive, crosses the time axis at the peak, and then continues negatively.
📊 The Relationship Between Velocity-Time Graph and Displacement
The instructor explains the connection between the velocity-time graph and displacement. By analyzing the area under the velocity-time graph, the viewer can determine the displacement of the object. The area under the graph is calculated as half the base (time) multiplied by the height (velocity), resulting in units of meters, which represent displacement. The instructor uses a triangle to illustrate this concept, showing that the area under the graph before the object reaches its maximum height and after it falls back down can be used to calculate the total displacement. The paragraph reinforces the idea that the gradient under the velocity-time graph represents gravitational acceleration, which is constant at 9.8 m/s².
📉 Position-Time Graphs for Vertical Motion Scenarios
The discussion moves to position-time graphs, starting with a scenario where an object is thrown upwards and then falls back to the ground. The instructor uses the ground as a reference point, with the graph beginning at a positive position if the object is thrown from a height. As time progresses, the object's position decreases towards the ground, resulting in a downward-sloping line on the graph. If the direction 'up' is considered positive, the graph will start above the time axis and move downwards, indicating the object's decreasing height. The instructor also mentions that if 'down' is considered positive, the graph would reflect this by starting below the time axis and moving upwards, which would complicate the visualization.
🚀 Acceleration-Time Graphs and Bouncing Ball Scenarios
The instructor introduces acceleration-time graphs, noting that acceleration due to gravity remains constant at 9.8 m/s², regardless of the object's motion. The graph for gravitational acceleration is a straight horizontal line at -9.8 m/s² if 'up' is considered positive, or +9.8 m/s² if 'down' is positive. The paragraph then transitions to a bouncing ball scenario, where the ball is thrown upwards, misses a catch, bounces off the ground, and reaches a new height before coming to rest. The instructor labels different points of the ball's trajectory and begins to draw the relevant velocity-time graph, indicating how the velocity changes from positive to negative and back to positive as the ball bounces.
🔄 Velocity-Time Graph for an Inelastic Collision
This paragraph focuses on the specifics of the velocity-time graph for a bouncing ball that undergoes an inelastic collision with the ground. The instructor explains that the velocity of the ball just before it touches the ground would be high and positive, but upon impact, some energy is converted into other forms, resulting in a lower velocity as the ball leaves the ground. The graph would show a sudden change in direction from negative to positive at the moment of impact, reflecting the change in velocity due to the collision. The instructor uses approximate values to illustrate the concept and emphasizes the brief period of time over which this change occurs.
📉 Position-Time Graph for a Bouncing Ball
The instructor describes the position-time graph for the bouncing ball scenario. Starting from a height, the ball's position is plotted against time, resulting in a parabolic shape. The graph begins at the initial height, rises to the first maximum height (the apex of the ball's trajectory), then turns and descends until it reaches the ground. There is a brief time lapse at the point of impact with the ground, after which the ball ascends again to a lower maximum height, following the parabolic curve. The instructor notes that the shape of the graph remains the same regardless of whether the ground or the point of throw is considered the zero position.
⏱️ Acceleration-Time Graph for a Ball in Free Fall and Bounce
The acceleration-time graph for the bouncing ball scenario is discussed, with the instructor pointing out that the graph would show a constant gravitational acceleration of -9.8 m/s², as acceleration due to gravity is constant and acts downwards. However, at the moment of impact with the ground, the ball experiences an extremely large upward force, resulting in a brief period of positive acceleration. This is represented by an almost vertical line on the graph, indicating a very high acceleration for a short time as the ball changes direction. After leaving the ground, the acceleration returns to -9.8 m/s², continuing as a constant value.
👍 Conclusion and Future Lesson Plans
In the concluding paragraph, the instructor summarizes the key points covered in the video, including the velocity-time and position-time graphs for various scenarios such as free fall, vertical throws, and bouncing balls. The instructor expresses hope that the video has been helpful and encourages viewers to like the video and subscribe to the channel for more physics lessons. There is a mention of future plans to work through past exam questions to demonstrate the application of these concepts and to interpret graphs for answering related questions.
Mindmap
Keywords
💡Projectile Motion
💡Velocity Time Graph
💡Displacement Time Graph
💡Acceleration
💡Free Fall
💡Elastic and Inelastic Collisions
💡Gradient
💡Position
💡Bouncing Ball
💡Reference Point
Highlights
Projectile motion graphs are important for understanding exams such as IEB and NSNCS.
Velocity-time graphs need to be labeled properly with velocity in meters per second and time in seconds.
The initial velocity of a dropped object is zero and increases as it falls due to gravity.
When drawing graphs, deciding the direction of positive (up or down) is crucial.
A velocity-time graph for a falling object is a straight line showing velocity increasing over time.
If 'up' is taken as positive, the graph is reflected across the time axis compared to taking 'down' as positive.
The gradient of a velocity-time graph represents the acceleration due to gravity (9.8 m/s²).
A position-time graph visually represents the motion of the object, showing it starting from a height and falling to the ground.
For an object thrown upwards, the velocity-time graph shows a decrease to zero at the maximum height and then a negative increase as it falls.
The area under a velocity-time graph represents the displacement of the object.
A bouncing ball scenario shows a quick change in velocity direction at the bounce points.
The acceleration-time graph remains constant at 9.8 m/s² except for a brief moment during the bounce when it spikes.
The gradient of a velocity-time graph can be used to calculate displacement using the area under the graph.
A position-time graph for a bouncing ball will show multiple parabolic arcs representing the bounces.
Interpreting and drawing projectile motion graphs are crucial skills for physics exams, and understanding them can help solve past exam questions.
Transcripts

5.0 / 5 (0 votes)
Thanks for rating: