Velocity Time Graph Grade 10 Science
TLDRThe video script provides an in-depth exploration of velocity-time graphs, contrasting them with displacement-time graphs. It emphasizes the importance of understanding the direction of motion (eastward as positive and westward as negative) and the concept of velocity as a measure of speed. The script explains that a positive velocity indicates motion to the east, while a negative velocity indicates motion to the west. Acceleration is described as an increase in velocity over time, and deceleration as a decrease. The process of calculating acceleration, distance, and displacement using the graph is detailed, with examples provided to illustrate how to find areas under different sections of the graph to determine these quantities. The script clarifies that while distance is a scalar quantity and can be found by adding the absolute values of the areas, displacement is a vector and its calculation must take into account the direction indicated by the sign of the velocity. The lesson concludes with a reminder that acceleration is independent of the direction of velocity and is solely based on the change in velocity over time.
Takeaways
- 📈 **Understanding Velocity-Time Graphs**: A velocity-time graph is different from a displacement-time graph and represents how velocity changes over time, not the distance covered.
- ➡️ **Positive and Negative Velocities**: In the context of velocity, 'East is positive' and 'West is negative', indicating direction rather than a lack of movement.
- 🚶♂️ **Walking at Constant Velocity**: When the velocity is constant (a flat line on the graph), it means the person is moving at a steady pace without acceleration or deceleration.
- ⏱️ **Calculating Acceleration**: Acceleration is calculated as the change in velocity over the change in time, which can be determined from the graph by finding the slope of the line between two points.
- 📊 **Area Under the Curve**: The total displacement can be found by calculating the area under the velocity-time graph, which represents the distance covered over time.
- 🔄 **Deceleration and Direction**: Deceleration occurs when the velocity decreases, but the direction of movement remains the same until a change is indicated on the graph.
- 🚴 **Bicycle Example**: The script uses the example of riding a bicycle to illustrate concepts such as acceleration, constant velocity, and deceleration.
- ⛔️ **Zero Velocity**: A velocity of zero on the graph indicates that the person or object is momentarily at rest, regardless of the direction.
- 🔀 **Change in Direction**: A change in direction is indicated by the velocity becoming negative after being positive (or vice versa), not by a decrease in velocity value.
- 📐 **Using Triangles and Rectangles**: To calculate the area under the curve for displacement, the graph can be divided into triangles and rectangles, which are easier to calculate.
- ⚖️ **Distance vs. Displacement**: Distance is a scalar quantity (no direction), while displacement is a vector (includes direction), so they are calculated differently from the graph.
Q & A
What is the difference between a displacement time graph and a velocity time graph?
-A displacement time graph shows the change in position over time, while a velocity time graph shows the speed and direction of an object's motion over time. Displacement is a vector quantity, which means it has both magnitude and direction, whereas velocity is a scalar quantity that can be positive or negative indicating direction.
How is velocity related to speed?
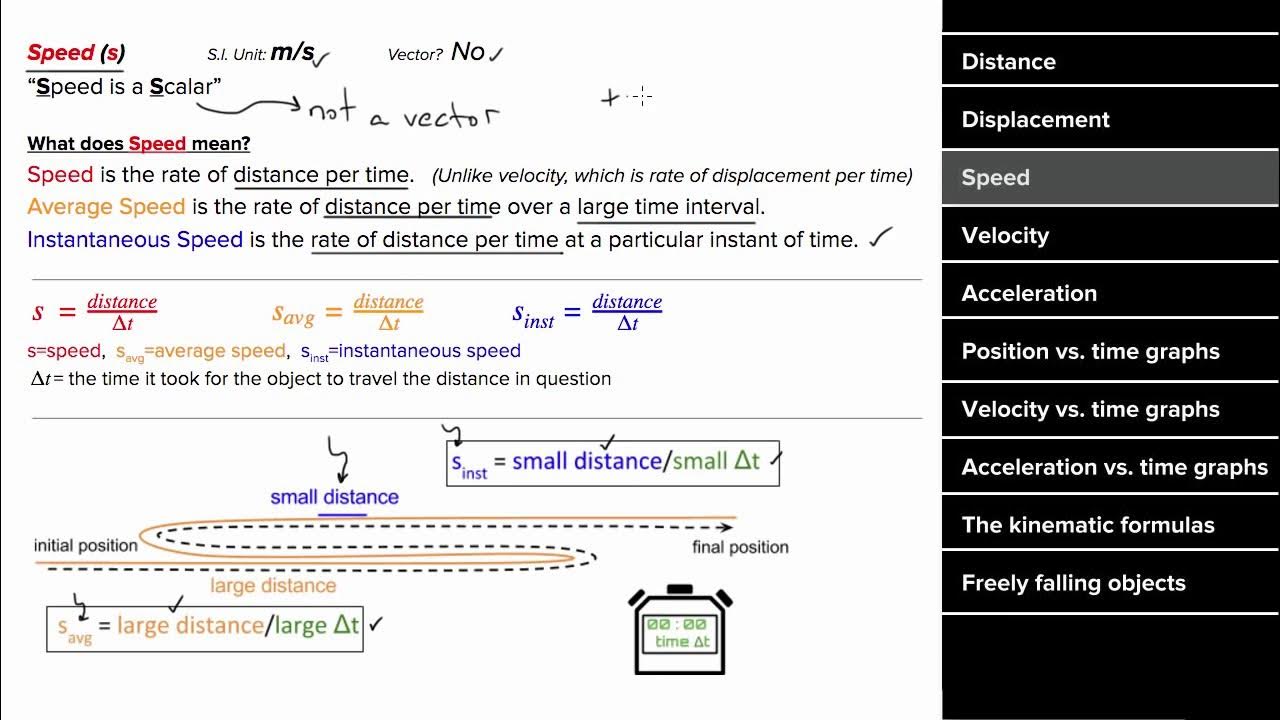
-Velocity is similar to speed, but it includes both the speed (how fast an object is moving) and the direction of the object's motion. Speed is a scalar quantity and only measures how fast an object is moving without considering direction.
What does a positive velocity value indicate in the context of the lesson?
-A positive velocity value indicates that the object is moving in an easterly direction, as per the convention established in the lesson where 'East is positive'.
What does it mean when the velocity graph shows a downward slope?
-A downward slope on a velocity graph indicates that the object is slowing down, or decelerating. This is a common misconception to interpret as a change in direction, but it simply means a decrease in speed while maintaining the same direction.
What does a negative velocity value represent?
-A negative velocity value indicates that the object is moving in a westerly direction (since 'West is negative' as per the lesson's convention). The magnitude of the negative value represents the speed at which the object is moving westward.
How can you determine if an object is accelerating or decelerating from a velocity time graph?
-An object is accelerating if the velocity value is increasing over time, regardless of the direction (positive or negative values). Conversely, the object is decelerating if the velocity value is decreasing over time.
What is the formula for calculating acceleration?
-The formula for calculating acceleration is the change in velocity over the change in time, which can be mathematically expressed as (final velocity - initial velocity) / (final time - initial time).
How is the area under a velocity time graph related to displacement?
-The area under a velocity time graph represents the total displacement of the object over the time period covered by the graph. The area must be calculated with consideration of the direction indicated by the sign of the velocity values.
What is the difference between calculating distance and displacement when analyzing a velocity time graph?
-Distance is a scalar quantity and is calculated by adding the absolute values of the areas under the velocity graph, disregarding the direction. Displacement, on the other hand, is a vector quantity and must take into account both the magnitude and direction of the object's movement, using the signed areas under the graph.
How can you determine the total distance traveled by an object using a velocity time graph?
-To determine the total distance traveled, you sum the absolute values of all the areas under the velocity graph segments between the time intervals of interest. This sum gives you the total distance, without considering the direction of travel.
What is the significance of a velocity value of zero on a velocity time graph?
-A velocity value of zero indicates that the object is momentarily at rest or not moving. It does not necessarily mean the object has changed direction unless it is preceded or followed by a change in the sign of the velocity values.
Why is it incorrect to assume that a flat line on a velocity time graph means the object is not moving?
-A flat line on a velocity time graph does not mean the object is not moving; rather, it indicates that the object is moving at a constant velocity. Any change in the slope of the line would indicate a change in acceleration, i.e., the object is speeding up or slowing down.
Outlines
📈 Understanding Velocity Time Graphs
This paragraph introduces the concept of velocity time graphs, contrasting them with displacement time graphs. It emphasizes that velocity is a measure of speed in a specific direction, with positive values indicating movement to the east and negative values to the west. The speaker clarifies that a downward slope on a velocity graph does not imply a change in direction, only a decrease in speed. The paragraph also explains the terms 'acceleration' and 'deceleration' in the context of changing velocities.
📏 Calculating Acceleration and Displacement
The second paragraph delves into the mathematical aspects of velocity time graphs, focusing on how to calculate acceleration and displacement. It defines acceleration as the change in velocity over time and provides a formula for calculating it. The paragraph also explains how to determine total displacement over a given time period by considering the area under the graph, which represents the distance covered. It distinguishes between distance, a scalar quantity, and displacement, a vector quantity that includes direction.
🚴♂️ Analyzing a Bicycle Ride Scenario
This paragraph applies the concepts discussed to a real-world scenario of riding a bicycle. It outlines how to interpret different sections of a velocity time graph in terms of acceleration, constant velocity, and deceleration. The explanation includes converting velocity from meters per second to kilometers per hour to better understand the speed involved. The paragraph also clarifies misconceptions about interpreting the graph, such as confusing a decrease in velocity with a change in direction or stopping.
🔢 Solving Practice Questions
The fourth paragraph presents practice questions to reinforce learning. It guides the listener through determining acceleration over a specific time interval and calculating total distance traveled. The paragraph demonstrates how to calculate the area under the graph to find the total distance and how to interpret the signs (positive or negative) to find the final displacement, taking into account the direction of movement.
📉 Decoding Deceleration and Direction Change
In this paragraph, the focus is on decelerating motion and changing direction on a velocity graph. It explains that a decrease in the velocity value indicates slowing down, regardless of the direction indicated by the sign. The paragraph also addresses the common mistake of interpreting a zero velocity as a stop, and a negative velocity as a reversal of direction. It concludes with the formula for calculating acceleration in a specific time frame and emphasizes the importance of understanding the direction of movement.
📚 Final Practice and Summary
The final paragraph wraps up the lesson with a summary of key points and an invitation to continue practicing with additional video resources. It reiterates the importance of understanding the difference between velocity and acceleration, especially when the velocity values are negative. The speaker assures that more practice questions will be available in subsequent videos to solidify the concepts learned.
Mindmap
Keywords
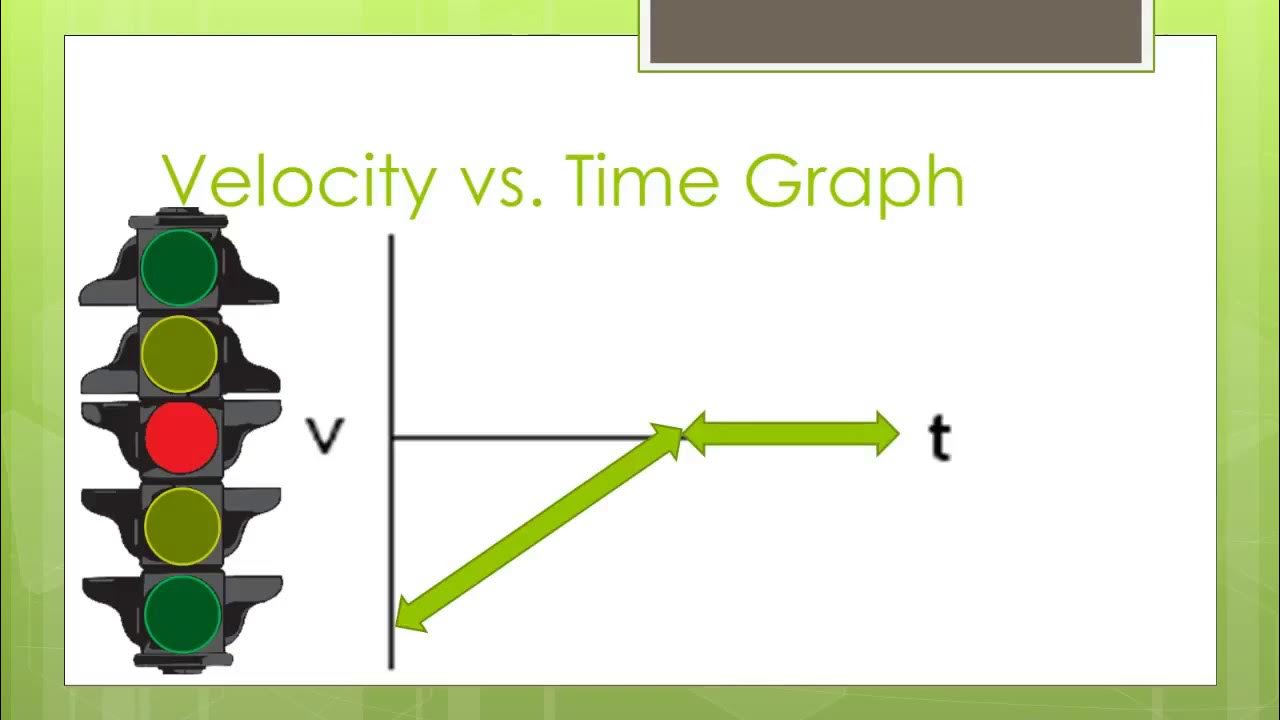
💡Velocity Time Graph
💡Displacement
💡Acceleration
💡Positive and Negative Values
💡Constant Velocity
💡Deceleration
💡Area Under the Graph
💡Direction
💡Speed
💡Meters per Second (m/s)
💡Distance
Highlights
The lesson focuses on understanding velocity time graphs, which are distinct from displacement time graphs.
Velocity is equivalent to speed and indicates how fast an object is moving, with direction also considered.
Positive velocity values correspond to eastward movement, while negative values indicate westward movement.
An increase in velocity signifies acceleration, whereas a decrease indicates deceleration.
The area under the velocity time graph represents the total displacement over time.
Displacement is a vector quantity, requiring both magnitude and direction, whereas distance is a scalar quantity.
The concept of acceleration is introduced as the change in velocity over time, with units of meters per second squared (m/s²).
The lesson demonstrates how to calculate the area under the graph to find total displacement and distance.
It is clarified that a flat line in a velocity graph does not imply the object is at rest, unlike in a displacement graph.
The importance of considering the direction of velocity when interpreting the graph is emphasized.
The lesson includes practical examples, such as calculating the acceleration and total distance traveled while riding a bicycle.
The difference between the velocity graph and displacement graph is further explained through the bicycle example.
The calculation of acceleration between specific time intervals is demonstrated using the formula final velocity minus initial velocity over final time minus initial time.
The lesson concludes with additional practice questions to reinforce the understanding of velocity time graphs.
A key takeaway is the ability to differentiate between acceleration, deceleration, and constant velocity from the graph's slope and direction.
The importance of recognizing that a negative velocity does not necessarily mean deceleration if the direction of movement is considered.
The lesson emphasizes the practical application of understanding velocity time graphs in real-world scenarios, such as bicycle motion.
Transcripts
Browse More Related Video
AP Physics 1 review of 1D motion
Position, Velocity, and Acceleration vs. Time Graphs
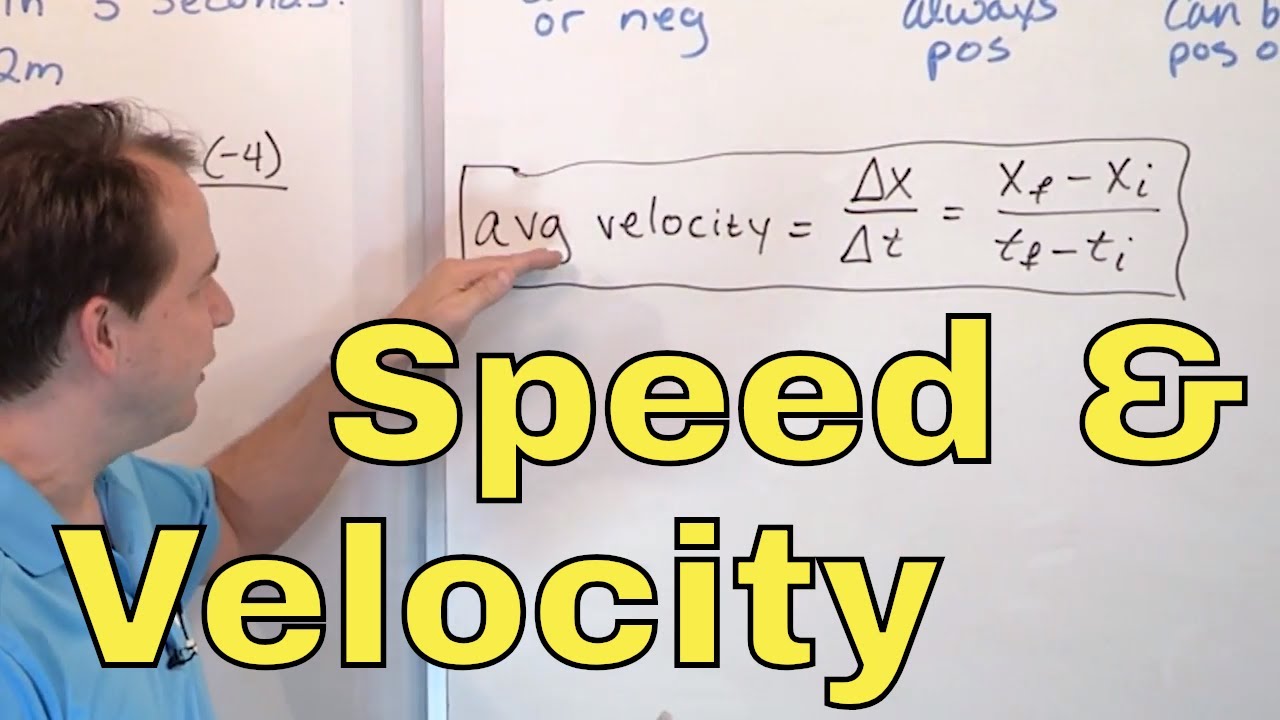
11 - What is Definition of Average Speed & Velocity in Physics? (Speed Formula & Velocity Formula)
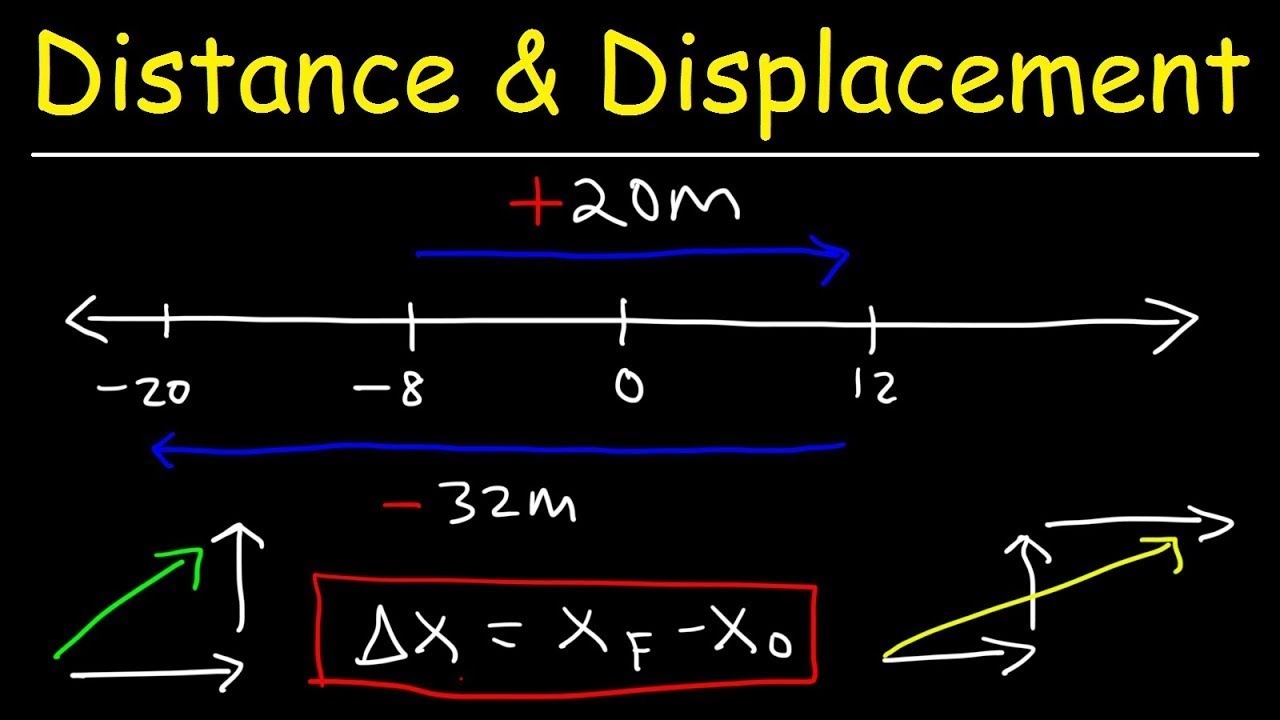
Distance, Displacement, Average Speed, Average Velocity - Physics

Velocity Time Graphs, Acceleration & Position Time Graphs - Physics
AP Calculus AB - Straight Line Motion
5.0 / 5 (0 votes)
Thanks for rating: