Graphs of Motion Velocity vs Time Graph past paper question
TLDRIn this educational video, Miss Martins delves into the intricacies of vertical projectile motion with a focus on velocity-time graphs, a crucial topic for grade 12 physics students. She begins with a concise review of velocity-time graphs, explaining their axes and how these graphs can indicate changes in motion direction and speed. The tutorial progresses with detailed analysis of a sample graph showing the movement of a remote-controlled car, demonstrating how to interpret sections above and below the x-axis for directionality and speed. Miss Martins further illustrates how to calculate acceleration and displacement from the graph, providing a clear, step-by-step guide to mastering graph interpretation and application in physics problems.
Takeaways
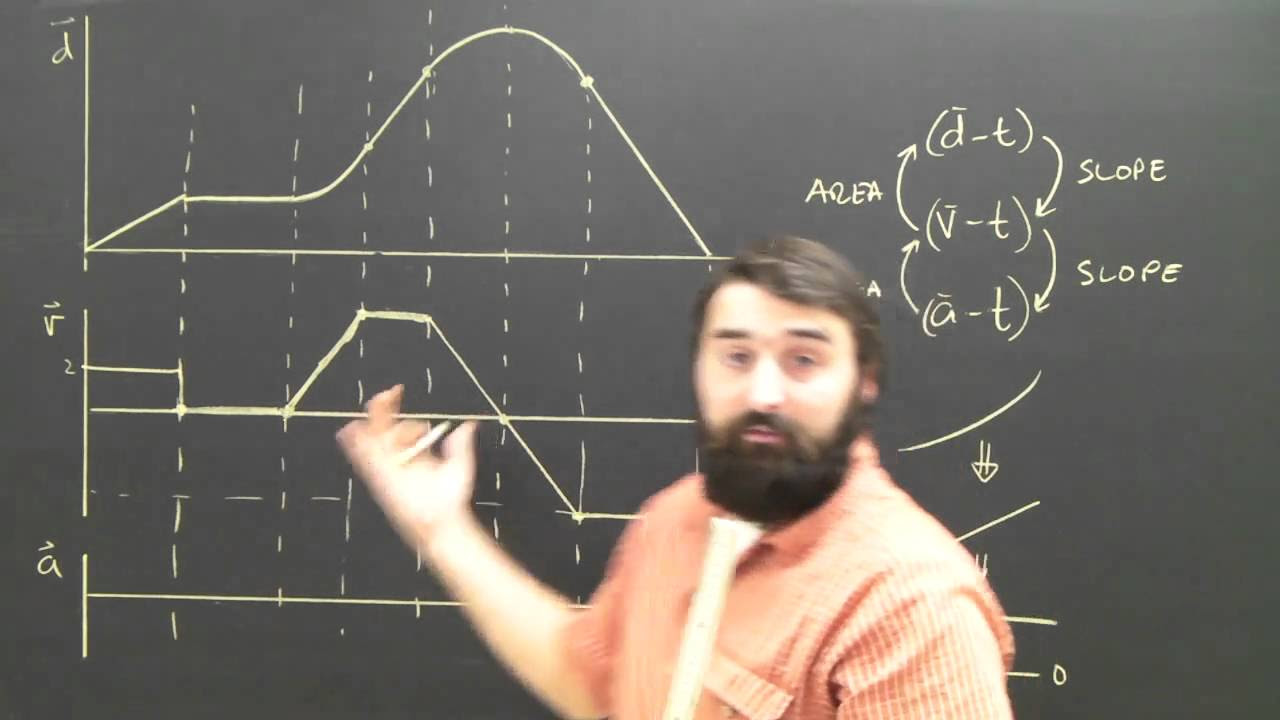
- 📈 The velocity-time graph is used to analyze motion, with the vertical axis representing velocity in meters per second and the horizontal axis representing time in seconds.
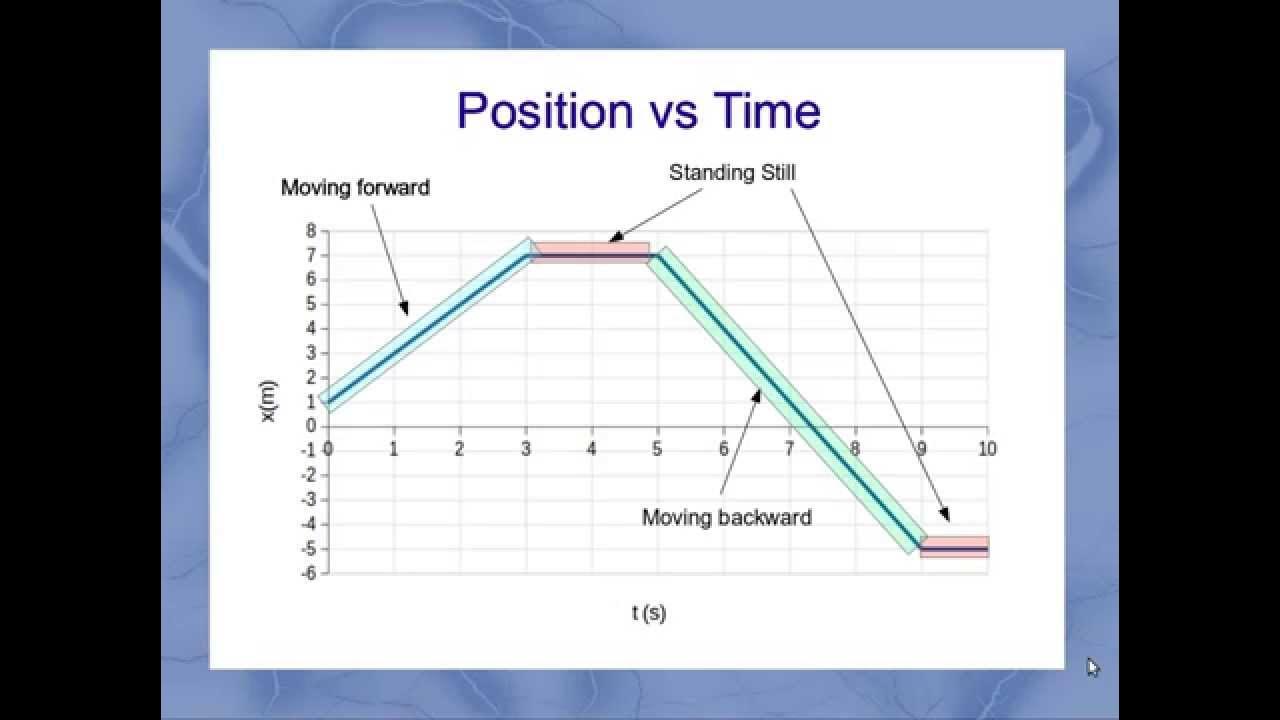
- 🚗 When the velocity is above the x-axis, the object is moving in the positive direction, and when below, it's moving in the negative direction.
- ↗️ If the graph's slope is increasing, it indicates the object is accelerating, and if decreasing, it indicates deceleration.
- ⏱️ The area under the velocity-time graph between two points represents the displacement of the object during that time interval.
- 🔄 A change in direction is indicated when the graph crosses the x-axis, showing the object has stopped and is now moving in the opposite direction.
- ↕️ A horizontal line on the velocity-time graph signifies that the object is moving at a constant velocity.
- 📐 To calculate the gradient (slope) of the graph, which represents acceleration, you find the change in velocity (Δv) over the change in time (Δt).
- ⛓ The direction of acceleration or velocity is crucial and is determined by whether the graph is above or below the x-axis and the context provided.
- 📐 When calculating displacement from the graph, you can use geometric shapes like triangles and trapeziums to find the area under the curve.
- ✍️ It's important to use the correct units when calculating acceleration from the graph, which is meters per second squared (m/s²).
- 🚫 Students should not use equations of motion to find displacement or acceleration if the question specifically asks for calculations based on the graph.
- 🧮 Displacement is a vector quantity, and its direction is indicated by whether the calculated area is above or below the x-axis, with the direction given as positive or negative.
Q & A
What is the significance of the direction of motion in relation to the x-axis on a velocity-time graph?
-On a velocity-time graph, if the graph is above the x-axis, the object is moving in the positive direction, and if it is below the x-axis, the object is moving in the negative direction. The specific direction (e.g., north or south) is determined by the initial direction of motion mentioned in the problem.
How does the area under a velocity-time graph relate to displacement?
-The area under a velocity-time graph represents the displacement of the object. Displacement is the change in position, and the area under the graph can be calculated by breaking it down into geometric shapes like triangles, rectangles, or trapeziums.
What does the gradient of a velocity-time graph indicate?
-The gradient of a velocity-time graph indicates the acceleration of the object. A positive gradient means the object is speeding up, while a negative gradient means the object is slowing down.
When is it appropriate to use equations of motion instead of the graph to calculate displacement or acceleration?
-Equations of motion should be used instead of the graph when the problem does not specifically instruct you to use the graph. If the question asks to use the graph, you must calculate the area for displacement or the gradient for acceleration.
What is the initial direction of motion for the remote-controlled car in the example given?
-The remote-controlled car initially moves in a southerly direction, as stated in the problem.
How would you describe the motion of the car from 0 to 1 second according to the script?
-The car starts from rest with a velocity of zero meters per second and travels southwards with a uniformly increasing velocity, reaching 2 meters per second, indicating positive acceleration.
What happens to the car's velocity between 2.7 seconds and 4 seconds?
-The car's velocity decreases uniformly from 2 meters per second to zero meters per second, indicating it is slowing down. After 2.7 seconds, the car stops momentarily before changing direction and starting to move northwards with an increasing velocity.
What is the acceleration of the car between 6 and 7 seconds, and in which direction does it act?
-The acceleration of the car between 6 and 7 seconds is 1 meter per second squared, acting in the southerly direction, as indicated by the positive gradient of the graph in that interval.
How should the displacement of the car over eight seconds be calculated using the graph?
-The displacement should be calculated by finding the area under the graph for the entire time period, which may involve breaking it down into triangles and trapeziums, and considering the direction of motion.
What is the final displacement of the car after eight seconds, and in which direction does it point?
-The final displacement of the car after eight seconds is 0.45 meters in the northerly direction, indicating the car moved more northwards than it did southwards after changing direction.
Why should the negative sign in the displacement not be left as is when providing the final answer?
-The negative sign indicates the direction of displacement, not the magnitude. It should be converted to a positive value with a direction (e.g., northerly) to clearly communicate the magnitude and direction of the displacement.
How does the shape of the velocity-time graph (straight lines) indicate the nature of the acceleration?
-Straight lines on a velocity-time graph indicate that the acceleration is constant. If the acceleration were not constant, the graph would curve, which would be characteristic of a position-time graph rather than a velocity-time graph.
Outlines
📊 Understanding Velocity-Time Graphs
Miss Martins introduces the concept of velocity-time graphs, essential for understanding vertical projectile motion in Grade 12 physics. She explains the axes of the graph—velocity in meters per second and time in seconds. The video emphasizes the importance of the direction indicated on the graph, explaining that values above the x-axis represent motion in the positive direction (southwards in this example), while values below indicate motion in the opposite direction (northwards). She notes that the area under the graph represents displacement and the gradient indicates acceleration. This introduction sets the stage for solving past paper questions on this topic.
🔍 Detailed Analysis of Motion from 0 to 4 Seconds
The video delves into describing the motion of a car from 0 to 4 seconds using the velocity-time graph. Initially, from 0 to 1 second, the car accelerates positively as it speeds up southwards. From 1 second to approximately 2.7 seconds, the car's velocity decreases, indicating negative acceleration but still moving southwards. At 2.7 seconds, the velocity hits zero, marking a stop before it starts moving northwards from 2.7 to 4 seconds, with increasing negative velocity, indicating a change in direction to north.
🚗 Analyzing Northward Motion and Calculating Acceleration
From 2.7 to 4 seconds, the car's velocity increases in the northward direction, indicated by the negative increase on the graph. Miss Martins clarifies that the negative value does not imply slowing down but rather an increase in speed in the opposite direction. Furthermore, she describes how to use the graph to calculate acceleration between 6 and 7 seconds by finding the gradient of the line, emphasizing the importance of using the graph over equations of motion for accurate calculations.
📏 Displacement Calculation and Summary
Miss Martins explains how to calculate the total displacement of the car over 8 seconds using the graph. She breaks the graph into segments—triangles and trapeziums—to calculate the area, which represents displacement. A detailed explanation is provided on how to use the graph's negative and positive areas to accurately determine the overall displacement in the correct direction (northward in this case). The video concludes with a call to action, encouraging viewers to subscribe for more educational content.
Mindmap
Keywords
💡Vertical Projectile Motion
💡Velocity-Time Graph
💡Axes
💡Displacement
💡Acceleration
💡Gradient
💡Direction
💡Uniform Increase/Decrease
💡Motion
💡Area Under the Graph
Highlights
Introduction to the importance of understanding graphs of motion for vertical projectile motion in grade 12.
Explanation of velocity versus time graphs as a key focus during exam periods.
Details on interpreting velocity direction from velocity-time graphs, especially above and below the x-axis.
Importance of noting initial direction of motion as it affects answers in motion graph questions.
Clarification that areas above the x-axis indicate motion in a positive direction, using southwards motion as an example.
Explanation of how a decreasing graph from an increasing one does not imply change in direction but a slowdown.
Recap that the area under a velocity-time graph represents displacement.
Explanation of how the gradient of a velocity-time graph is related to acceleration.
Discussion of the use of graphs for calculating displacement or acceleration instead of motion equations.
Step-by-step breakdown of motion description from 0 to 1 second, emphasizing the starting from rest.
Details on the motion of the car from 1 second to 4 seconds, highlighting the transition from slowing down to changing direction.
Specific breakdown of changes in the car's velocity and direction at 2.7 seconds.
Method for using the graph to calculate acceleration between specific times, emphasizing the need for using gradient.
Procedure for calculating displacement using the area under the graph, including breaking it into shapes like triangles and trapezoids.
Conclusion that emphasizes the importance of understanding the vector nature of displacement and acceleration.
Transcripts
Browse More Related Video
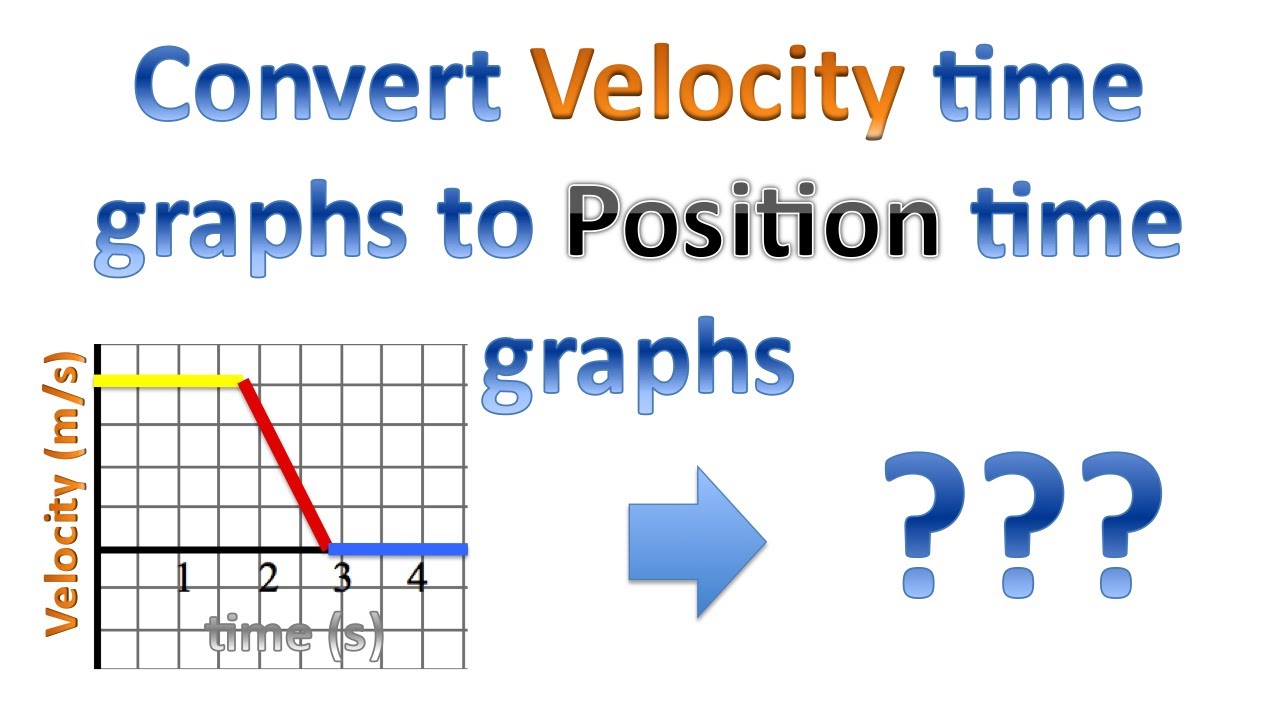
Velocity time graph conversion to Position time graph
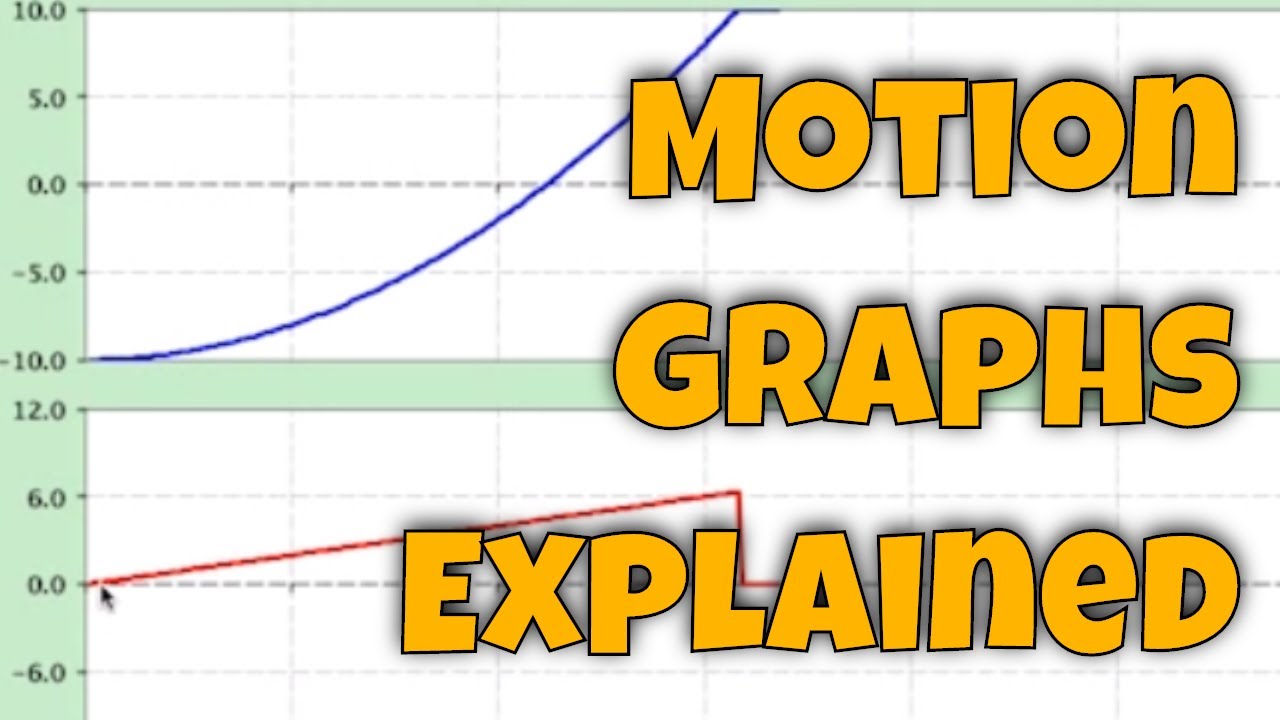
motion graphs explained
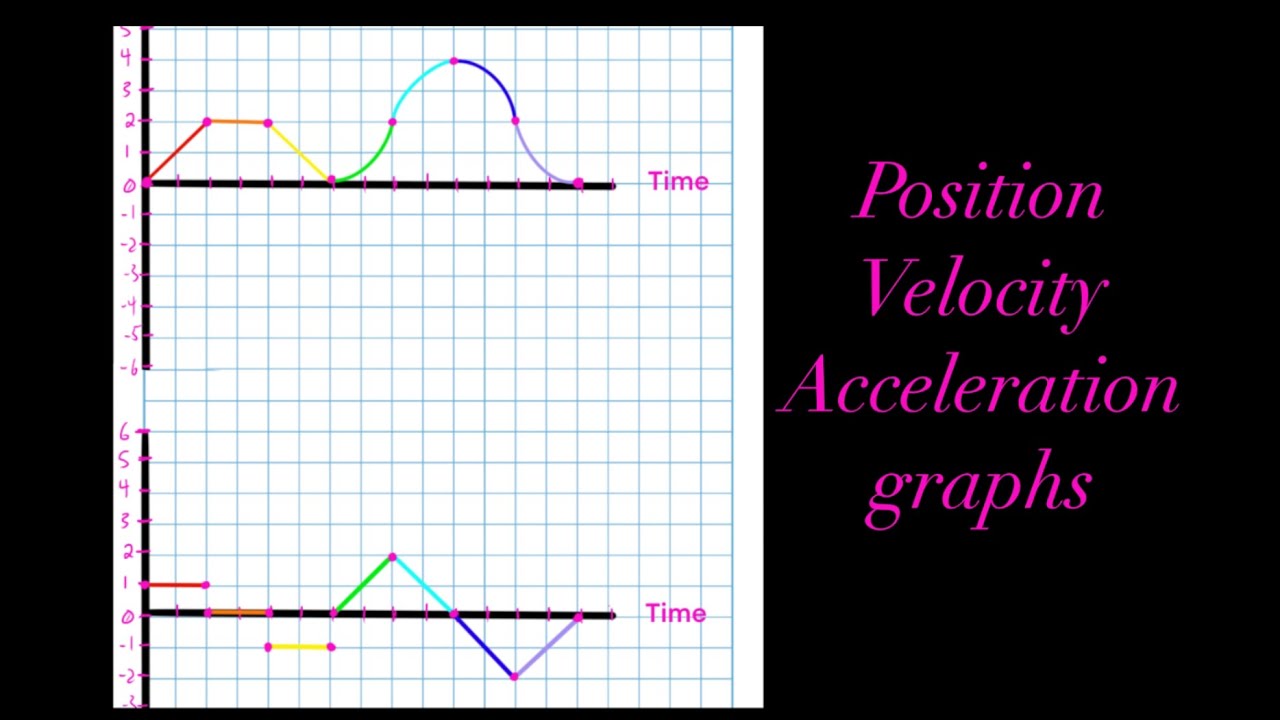
Position vs Time, Velocity vs Time & Acceleration vs Time Graph (Great Trick to Solve Every Graph!!)
Visualizing Motion Using Tape Charts and Motion Graphs | SCIENCE 7 QUARTER 3 MODULE 2 WEEK 3
Distance (position) to Velocity Time Graph Physics Help
Interpreting Motion Graphs
5.0 / 5 (0 votes)
Thanks for rating: