Finding Maximums and Minimums EXPLAINED with Examples
TLDRIn this educational video by Mark from Ace Tutors, viewers are guided through the process of identifying maximum and minimum points of a function using calculus. The distinction between absolute and relative extremities is clarified, and the importance of understanding derivatives and concavity is highlighted. The method involves taking the first derivative, setting it to zero to find potential extremities, and then classifying these points using either the first or second derivative test. Two examples illustrate the process, demonstrating how to find and classify relative maxima and minima, ultimately empowering students to tackle these calculus concepts with confidence.
Takeaways
- 📚 The video is an educational tutorial by Mark from Ace Tutors on finding maximum and minimum points of a function.
- 🔍 It's recommended to watch previous videos on derivatives and concavity for foundational knowledge.
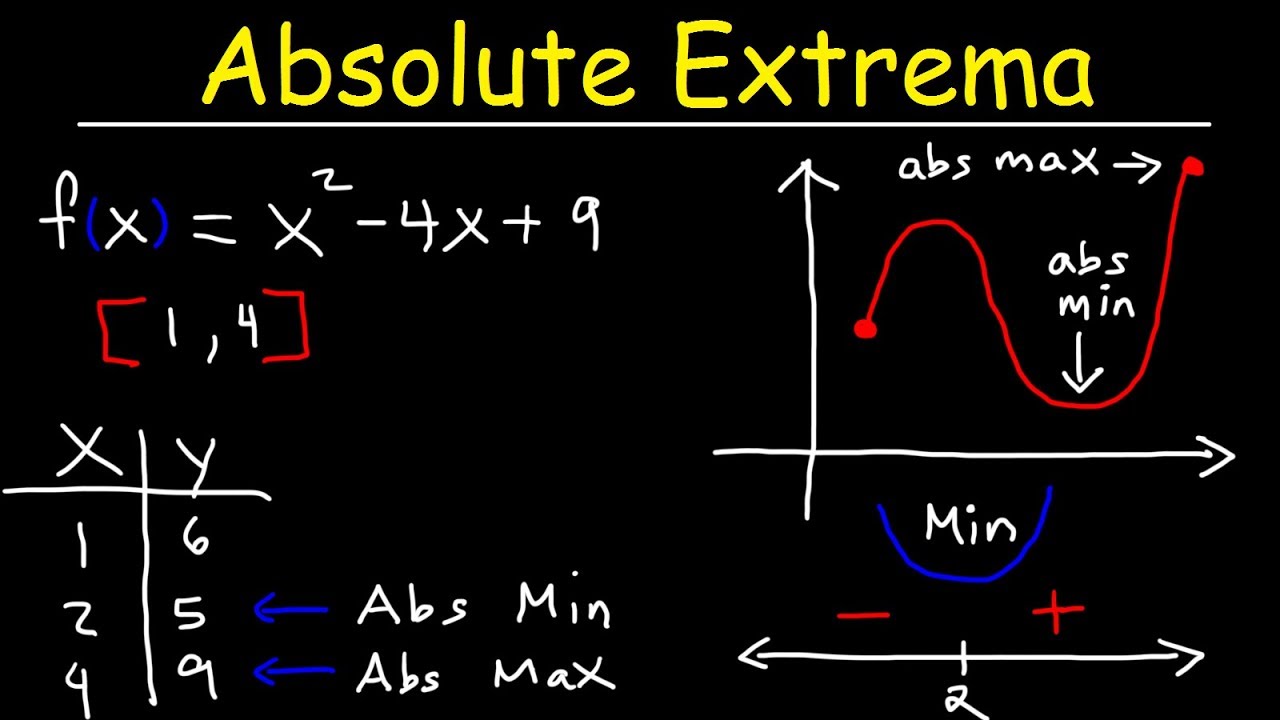
- 📈 The script explains the difference between absolute and relative maximums and minimums on a graph.
- 🔺 Absolute extrema are the highest or lowest points on the entire graph, while relative extrema are local peaks or valleys.
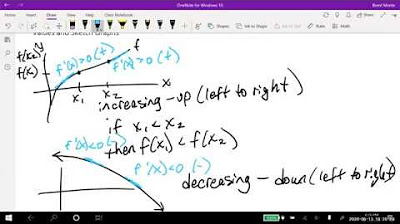
- 📉 A defining feature of relative extrema is that the slope of the curve is zero at these points.
- 🧐 To find relative maximums and minimums, one must first calculate the function's derivative and set it equal to zero.
- 📝 The process involves solving for x to find the x-coordinates and then substituting these into the original function to find corresponding y-values.
- 🔎 Two methods to classify maximums and minimums are introduced: the first derivative test and the second derivative test.
- 📊 The first derivative test involves checking the sign of the derivative to the left and right of a critical point to determine if it's a maximum or minimum.
- 📚 The second derivative test uses the concavity indicated by the sign of the second derivative to classify the point as a maximum or minimum.
- 📘 Two examples are provided in the script to demonstrate the process of finding and classifying maximums and minimums.
- 👍 The tutorial encourages viewers to like and subscribe to the channel for more educational content.
Q & A
What is the main topic of the video by Mark from Ace Tutors?
-The main topic of the video is teaching how to find the maximum and minimum points of a function using calculus.
Why is it recommended to watch videos on derivatives and concavity before this video?
-It is recommended because the concepts of derivatives and concavity are foundational to understanding how to find maximum and minimum points of a function.
What is the difference between an absolute maximum and a relative maximum?
-An absolute maximum is the highest point on the entire graph, whereas a relative maximum is any peak along the curve, which can be one of several on the graph.
Can a point be both an absolute and a relative maximum or minimum?
-Yes, some points can be both an absolute and a relative maximum or minimum, as explained in the video.
How does the slope of a curve around a minimum point typically behave?
-The slope of the curve around a minimum point is negative to the left of the point, positive to the right, and exactly zero at the minimum point itself.
What is the first step in finding relative maximums and minimums using calculus?
-The first step is to find the function's derivative and set it equal to zero because the slope at a maximum or minimum is zero.
How do you find the y-coordinate corresponding to a critical point found by setting the derivative to zero?
-You plug the x-coordinate of the critical point into the original function to find the corresponding y-coordinate.
What are the two methods to classify maximums and minimums after finding them?
-The two methods to classify maximums and minimums are the first derivative test and the second derivative test.
How does the first derivative test work to classify a point as a maximum or minimum?
-The first derivative test involves plugging in x values to the left and right of the critical point into the first derivative to see if the slope goes from positive to zero to negative (indicating a maximum) or from negative to zero to positive (indicating a minimum).
How does the second derivative test classify a maximum or minimum point?
-The second derivative test involves plugging the x value of the critical point into the second derivative. If the result is negative, the point is a maximum because the curve is concave down; if positive, it's a minimum because the curve is concave up.
What is the process to find relative maximums and minimums of a function as outlined in the video?
-The process involves taking the derivative of the function, setting it equal to zero, solving for x, using those x values to find corresponding y values in the original function, and finally classifying each point using either the first or second derivative test.
Outlines
📚 Introduction to Maximum and Minimum Points
Mark from Ace Tutors introduces the concept of finding maximum and minimum points of a function, emphasizing the importance of understanding derivatives and concavity. He distinguishes between absolute and relative maximums and minimums, explaining that absolute points are the highest or lowest on the graph, while relative points are local peaks or valleys. Mark also mentions that some points can be both absolute and relative. The process of finding these points involves taking the derivative of the function, setting it to zero, and solving for x to find critical points, which are potential maximums or minimums.
🔍 Techniques for Identifying Maximums and Minimums
The video script delves into the methods for identifying maximum and minimum points of a function. It begins with the first derivative test, which involves analyzing the sign of the derivative to the left and right of a critical point to determine if it is a maximum or minimum. If the slope transitions from positive to zero to negative, the point is a maximum; if it goes from negative to zero to positive, it is a minimum. The second derivative test is also discussed, which uses the concavity indicated by the second derivative's sign to classify the point. A negative second derivative indicates a maximum (concave down), while a positive second derivative indicates a minimum (concave up). The script provides a step-by-step example using the function f(x) = -x^2 + 2x + 3, showing how to find the derivative, set it to zero, solve for x, and use the first derivative test to classify the point as a relative maximum.
📈 Applying Derivative Tests to Classify Extrema
In this section, the script applies the previously discussed derivative tests to classify the extrema of a function. It provides an example using the function f(x) = x^3 - 3x^2 - 9x + 5, showing the process of finding the first derivative, setting it to zero, and solving for x to find critical points. The critical points are x = -1 and x = 3, and their corresponding y-values are calculated by plugging these x-values back into the original function. The second derivative test is then used to classify these points. For x = -1, the second derivative test indicates a relative maximum, while for x = 3, it indicates a relative minimum. The script concludes with a reminder of the process for finding relative maximums and minimums, encouraging viewers to apply these techniques to understand the behavior of functions.
Mindmap
Keywords
💡Maximum
💡Minimum
💡Derivative
💡Slope
💡Relative
💡Absolute
💡First Derivative Test
💡Second Derivative Test
💡Concavity
💡Power Rule
Highlights
Introduction to finding maximum and minimum points of a function.
Importance of understanding derivatives and concavity for this topic.
Explanation of absolute versus relative maximums and minimums.
Identification of absolute maximums and minimums on a graph.
Description of relative maximums and minimums as peaks or valleys on a graph.
Potential for points to be both absolute and relative maximums or minimums.
Method to find relative maximums and minimums using calculus.
Defining feature of a minimum where the slope changes from negative to positive.
Process of finding maximums and minimums by setting the derivative equal to zero.
Example problem to find relative maxes and mins of a quadratic function.
Use of the power rule to find the derivative of a given function.
Solving for x when the derivative is set to zero.
Finding the corresponding y-coordinate for a given x.
Introduction of the first derivative test to classify max or min points.
Explanation of how the first derivative test works using slope values.
Introduction of the second derivative test for classification.
How the second derivative indicates concavity and helps classify max or min.
Demonstration of classifying a max or min using the first derivative test.
Another example problem with a cubic function to find relative maxes and mins.
Factoring the derivative to find critical points.
Using the second derivative test to classify critical points.
Summary of the process to find relative maximums and minimums of a function.
Encouragement to like and subscribe for educational content.
Transcripts
Browse More Related Video


5.0 / 5 (0 votes)
Thanks for rating: