Calculus 1 Lecture 3.3: The First Derivative Test for Increasing and Decreasing
TLDRThe transcript is a detailed instructional discourse on curve sketching and the application of the first derivative test in calculus. The speaker emphasizes the importance of understanding the shape of curves beyond the capabilities of a calculator. They introduce the first derivative test as a method to determine the increasing or decreasing nature of a function, which is crucial for identifying relative extrema. The process involves taking the first derivative of a function, setting it to zero to find critical numbers, and using these to create a first derivative table that helps in graphing the function. The speaker also touches on the concept of concavity and the role of the second derivative. The narrative is instructional, guiding students through the mathematical reasoning behind the test, the significance of critical points, and how to apply the test to find relative maxima and minima. The summary provides a glimpse into the mathematical concepts taught, highlighting the educational value of the content.
Takeaways
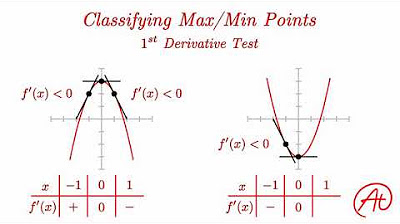
- 📈 The first derivative test is used to find relative extrema by analyzing the sign changes of the first derivative function.
- 🔍 Setting the first derivative equal to zero helps in finding critical numbers, which are potential points for relative maxima or minima.
- 📊 A first derivative table is a useful tool to organize information and visualize the behavior of a function's slope across different intervals.
- 🔢 The sign of the first derivative at a point indicates whether the function is increasing (positive) or decreasing (negative) at that point.
- ✍️ The process involves taking the first derivative of a function, setting it to zero, creating a table, and then evaluating the sign of the derivative in different intervals.
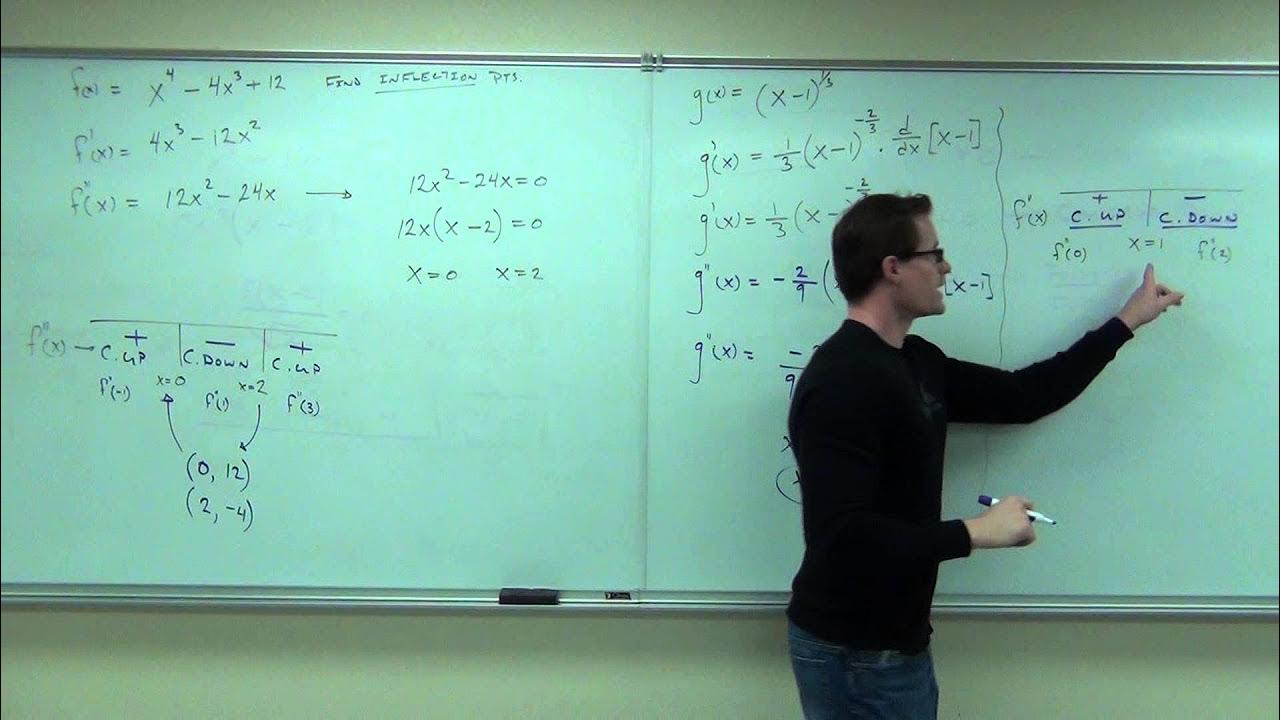
- 🔄 The second derivative test can be used to determine concavity and can provide additional information about the nature of the extrema.
- 🚫 It's important to include points where the derivative is undefined, such as asymptotes, in the analysis as they can affect the function's behavior.
- 📋 The first derivative test is not just about finding where the slope is zero but also about understanding the overall behavior of the function's slope.
- 📌 Critical points are not only the zeros of the first derivative but also points where the function might be undefined due to the denominator being zero.
- 🤔 To find the actual relative extrema, plug the x-values of the critical points into the original function to find the corresponding y-values.
- 📐 The first derivative test is a part of curve sketching, which helps in understanding the shape and features of a graph without using a calculator.
Q & A
What is the purpose of curve sketching in calculus?
-Curve sketching helps to understand why curves have the shapes they do. While calculators can plot curves, sketching manually leads to a deeper understanding of the mathematical principles behind their shapes.
What does the first derivative of a function indicate?
-The first derivative of a function indicates the slope of the tangent line to the curve at a given point. It tells us whether the function is increasing or decreasing at that point.
How is the first derivative test used to find relative extrema?
-The first derivative test involves taking the first derivative, setting it equal to zero to find critical numbers, and then testing intervals around these numbers to determine if they correspond to relative maxima or minima based on the sign of the derivative.
What is the significance of the second derivative in determining concavity?
-The second derivative of a function indicates how the slope of the tangent is changing. A positive second derivative indicates the function is concave up, while a negative second derivative indicates concave down.
What are critical numbers in the context of calculus?
-Critical numbers are the values of the independent variable (usually denoted as 'x') for which the first derivative is either zero or undefined. These points are potential locations for relative maxima or minima.
How does the sign of the first derivative relate to the increasing or decreasing nature of a function?
-If the first derivative is positive over an interval, the function is increasing on that interval. Conversely, if the first derivative is negative, the function is decreasing.
What is the role of a number line in the first derivative test?
-A number line is used in the first derivative test to organize and visualize the critical numbers. It helps in systematically testing intervals between critical numbers to determine the behavior of the function (increasing or decreasing).
Why is it important to consider undefined values from the original function when conducting the first derivative test?
-Undefined values, often due to asymptotes, must be considered because they can represent points where the function changes from increasing to decreasing (or vice versa) without being represented as a critical number in the first derivative test.
How do you determine if a critical point is a relative maximum or minimum?
-To determine if a critical point is a relative maximum or minimum, one can use the first derivative test by evaluating the sign of the derivative to the left and right of the critical point. A change from positive to negative indicates a relative maximum, while a change from negative to positive indicates a relative minimum.
What is the relationship between the first derivative and the slope of the tangent line?
-The first derivative of a function at a specific point is equal to the slope of the tangent line to the graph of the function at that point. A zero first derivative indicates a horizontal tangent line.
Why is the second derivative test used in addition to the first derivative test?
-The second derivative test is used to determine concavity and to identify inflection points. It also helps to distinguish between relative maxima and minima when the first derivative test is inconclusive due to the presence of horizontal tangents or undefined slopes.
Outlines
📈 Introduction to Curve Sketching and First Derivative Test
The video begins with an introduction to curve sketching, emphasizing its importance for understanding the shape of curves beyond what a calculator can show. The presenter then delves into the first derivative test, explaining its relevance to identifying increasing and decreasing functions. The concept of critical numbers and points is introduced, and the process of finding relative extrema using a graphic organizer is outlined.
📊 First Derivative Table and Sign Analysis
The presenter explains how to create a first derivative table, which is a method to organize the graph of a function. The table includes critical numbers and helps in determining whether the function is increasing or decreasing at different points. The process involves setting the first derivative equal to zero, creating a table, and then testing points in each interval to find the sign of the derivative, which indicates the behavior of the function.
🔍 Identifying Undefined Points and Asymptotes
The video continues with a discussion on identifying undefined points in the first derivative, which can indicate asymptotes. The presenter explains the importance of including these points in the analysis because they can affect the function's behavior, such as changing from increasing to decreasing without being represented as a critical number in the first derivative test.
🔢 Finding Relative Extrema with the First Derivative Test
The presenter demonstrates how to use the first derivative test to find relative extrema by plugging in values for the first derivative at specific points. The process involves determining whether the function is increasing or decreasing and identifying relative maxima and minima based on the sign changes of the first derivative. The video also touches on the difference between relative and absolute extrema.
🧮 Solving for Critical Numbers and Understanding Their Significance
The presenter guides the audience through the process of solving for critical numbers by setting the first derivative equal to zero and factoring. The importance of including denominator values in the set of critical numbers is highlighted, especially when dealing with rational functions. The video also covers how to handle undefined values in the original function and their role in the first derivative test.
📉 Second Derivative Test and Curve Sketching
The video concludes with an introduction to the second derivative test, which is used to determine concavity and further analyze the behavior of the function. The presenter outlines the steps for conducting the second derivative test and hints at the upcoming topic of curve sketching, which will integrate the findings from the first and second derivative tests to understand the function's graph more comprehensively.
Mindmap
Keywords
💡Curve Sketching
💡First Derivative Test
💡Critical Numbers
💡Concavity
💡Second Derivative
💡Asymptotes
💡Relative Extrema
💡Undefined Values
💡Sign Analysis
💡Rational Functions
💡Zero Product Property
Highlights
Introduction to curve sketching which helps understand the shape and nature of curves beyond what a calculator can show.
Explanation of the first derivative test, a method to find relative extrema of a function.
The importance of understanding the difference between the first derivative (rate of change) and concavity (related to the second derivative).
Procedure to find critical numbers by setting the first derivative equal to zero.
Construction of a first derivative table to organize the information and prepare for graphing the function.
The significance of testing intervals around critical numbers to determine if they correspond to maxima, minima, or neither.
Technique to evaluate the sign of the first derivative within each interval to ascertain increasing or decreasing behavior of the function.
The concept of undefined values in the derivative and their importance in the context of asymptotes.
How to identify and label asymptotes and their impact on the function's behavior.
The process of using the first derivative test to determine if a critical number corresponds to a relative maximum, minimum, or neither.
The necessity of considering the function's domain, especially when dealing with rational functions and potential asymptotes.
How to find the actual relative extrema points by plugging the critical numbers into the original function.
Differentiation between relative extrema and absolute extrema, and the conditions under which absolute extrema occur.
The role of the second derivative in the context of the second derivative test for concavity and identifying inflection points.
Combining the first and second derivative tests to gain a comprehensive understanding of a function's behavior, including extrema and inflection points.
The application of these mathematical concepts in curve sketching to visualize and understand the function's graph more effectively.
Emphasis on the importance of algebraic manipulation and understanding the function's structure when taking derivatives.
Transcripts
Browse More Related Video

Relative Extrema

3.1 - Using First Derivatives to Classify Max and Min Values
Finding Maximums and Minimums EXPLAINED with Examples
Calculus 1 Lecture 3.4: The Second Derivative Test for Concavity of Functions

Calculus Review Maximum and Minimum Values of Functions

3.2 - Using Second Derivatives to Classify Max and Min Values
5.0 / 5 (0 votes)
Thanks for rating: