Find Critical Value Z for Confidence Intervals with TI-84
TLDRThis instructional video demonstrates how to calculate critical values for a 94% confidence interval using the TI-84 graphing calculator. It begins by explaining the concept of critical values and their significance in capturing a specific percentage of samples within the normal distribution curve. The video then proceeds to show two methods for finding these values: one for the newer TI-84 Color Edition and another for older models. The presenter guides viewers through the calculator's interface, illustrating the steps to input the necessary parameters and retrieve the critical values, which in this case are -1.88 and 1.88. The video concludes with an invitation for viewers to ask questions or request additional topics.
Takeaways
- 📚 The video is a tutorial on finding critical values for a 94% confidence interval using the TI-84 graphing calculator.
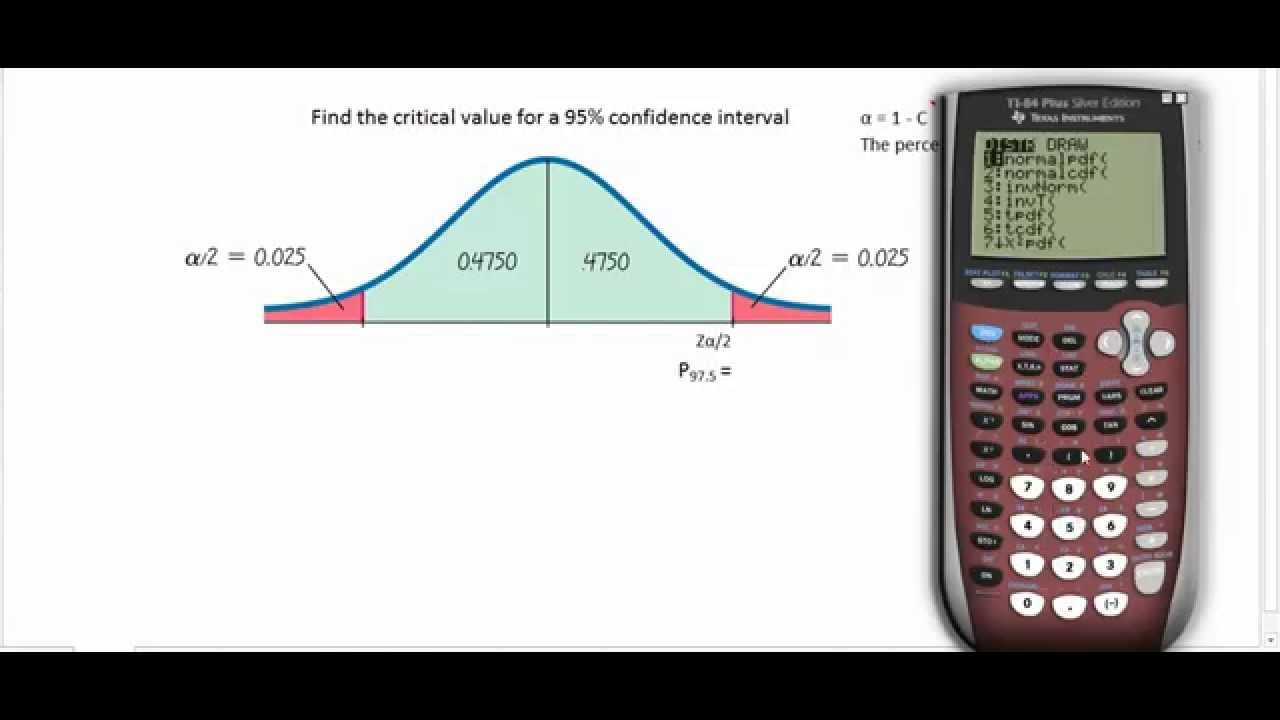
- 📈 The critical values are the points on the normal curve that define the endpoints of the confidence interval.
- 🔍 The goal is to capture 94% of the samples within the curve, leaving 6% in the tails.
- 📊 The area in the middle of the curve represents the level of confidence, which is 0.94 in this case.
- 🔢 To find the critical values, the calculator's inverse norm function is used, which calculates the z-score corresponding to the given confidence level.
- 📱 For older TI-84 models, the user inputs 1/2, 1 minus the confidence level, and 0, 1 to find the area in the tails.
- 💻 On newer TI-84 Color Edition calculators, there's an option to select 'Center' which simplifies the process.
- 👉 The video demonstrates both methods: the older method and the newer method with the 'Center' option.
- 📉 The critical values for a 94% confidence interval are found to be -1.88 and +1.88.
- 📝 Typically, only the positive z-score is reported as the critical value for the confidence interval.
- ❓ The video encourages viewers to ask questions or request additional topics for future tutorials.
Q & A
What is the main topic of the video?
-The main topic of the video is demonstrating how to find critical values zc or z* for a 94% confidence interval using a TI-84 graphing calculator.
What is the purpose of finding critical values in a normal curve?
-The purpose of finding critical values is to determine the values that end the confidence interval, ensuring that a certain percentage (in this case, 94%) of the samples are captured within the curve.
What does a 94% confidence interval mean in terms of the normal curve?
-A 94% confidence interval means that 94% of the area under the normal curve is within the interval, with 3% in each tail (0.06 total, divided by 2).
How does the video guide the viewer to find the critical values using the TI-84 calculator?
-The video provides step-by-step instructions on using the inverse norm function on the TI-84 calculator, with options for both older and newer models.
What is the difference between using the inverse norm function on an older TI-84 and the newer TI-84 Color Edition?
-The older TI-84 requires entering 1/2, 1 minus the level of confidence, and 0, 1, while the newer TI-84 Color Edition has a 'Center' option that simplifies the process by allowing you to input the level of confidence directly.
What is the critical z value for a 94% confidence interval according to the video?
-The critical z values for a 94% confidence interval are -1.88 and +1.88, as demonstrated on the TI-84 calculator.
Why are both positive and negative z scores important for the confidence interval?
-Both positive and negative z scores are important because they represent the symmetrical endpoints of the confidence interval on a normal curve.
How does the video handle the symmetry of the normal curve when finding critical values?
-The video acknowledges the symmetry by showing that if the negative z score is -1.88, then the positive z score is +1.88, and only the positive value is typically reported.
What is the significance of the area in the tails of the normal curve in this context?
-The area in the tails of the normal curve represents the remaining percentage of the data that falls outside the confidence interval, which in this case is 6% (0.06), divided equally between the two tails.
How can viewers get help if they have questions or need additional topics covered?
-Viewers can ask questions or request additional topics by reaching out to the video creator, as suggested at the end of the video.
Outlines
📊 Finding Critical Values for 94% Confidence on TI-84 Calculator
This paragraph introduces the video's objective, which is to demonstrate how to calculate the critical value zc or z star for a 94% confidence interval using a TI-84 graphing calculator. The presenter emphasizes the importance of visualizing the process by explaining the concept of a normal curve and its critical values, which define the endpoints of the confidence interval. The goal is to capture 94% of the samples within the curve, with the remaining 6% (0.06) distributed equally in the two tails. The video will show two methods to find these critical values using the calculator's inverse norm function, one for older TI-84 models and another for the newer TI-84 Color Edition, which includes a 'Center' option.
Mindmap
Keywords
💡Critical Value
💡Confidence Interval
💡Normal Curve
💡Z Score
💡TI-84 Graphing Calculator
💡Inverse Norm
💡Area in the Middle
💡Area in the Outside Tails
💡Level of Confidence
💡Symmetry
Highlights
The video demonstrates how to find a critical value zc or z star for a 94% confidence interval.
The process is explained using a TI-84 graphing calculator.
Critical values are the endpoints of the confidence interval on a normal curve.
A 94% confidence interval captures 94% of the samples in the normal curve.
The z score corresponding to the positive and negative endpoints for 94% confidence is sought.
The area outside the 94% confidence interval is calculated as 1 minus 0.94, resulting in 0.06.
The area in each tail is half of the total area outside the confidence interval, which is 0.03.
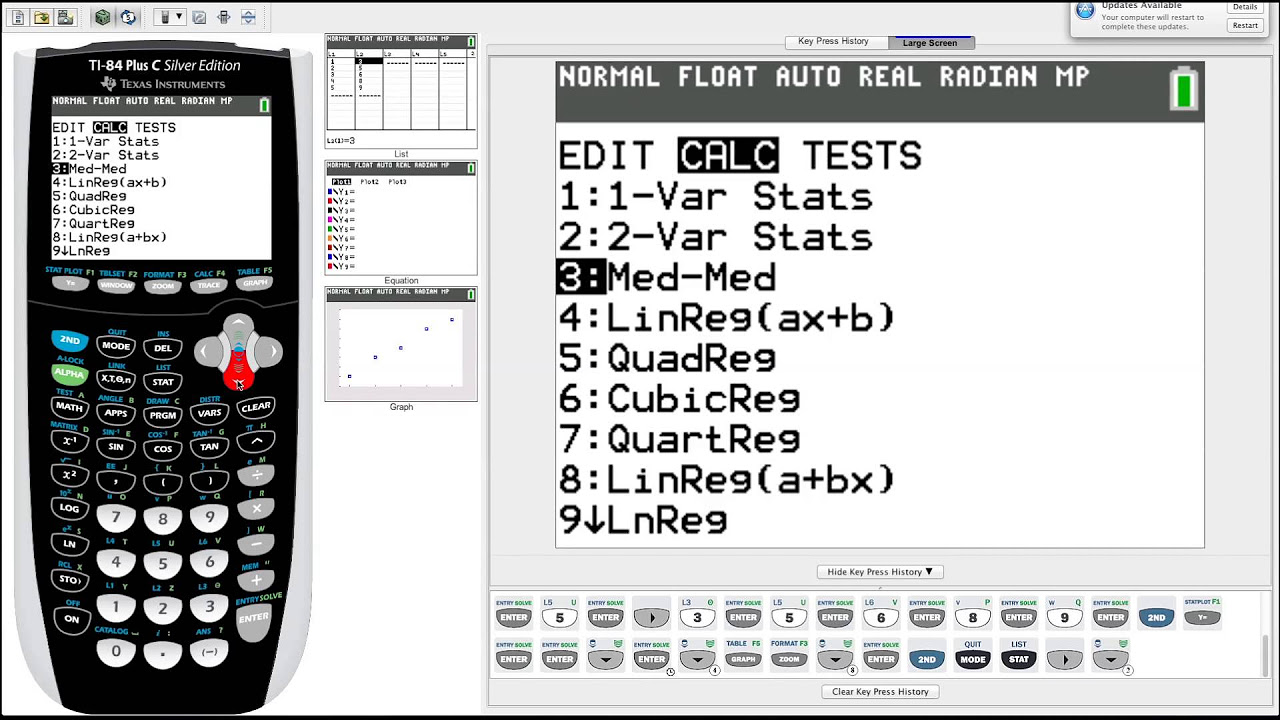
For older TI-84 calculators, the inverse norm function is accessed by pressing 2nd and Vars.
Input 1/2, 1 minus the level of confidence, and 0, 1 for the inverse norm function on older calculators.
The area in the tail is divided by 2 to find the area in each tail.
Newer TI-84 Color Edition calculators have a new feature for the inverse norm function.
On newer calculators, input the level of confidence, 0, 1, and select Center for the inverse norm.
The calculator provides the critical values that end the 94% area in the middle.
The critical values for a 94% confidence interval are -1.88 and 1.88.
Most calculators will provide only the negative critical value due to symmetry.
The positive z score of 1.88 is typically reported as the critical value for the confidence interval.
The critical value of 1.88 is the value that ends the confidence interval.
The video concludes with an invitation for viewers to ask questions or request additional topics.
Transcripts
Browse More Related Video
Finding Z Critical Values for a Given Confidence Level using the TI84
TI-84 Plus Graphing Calculator Guide: Statistics
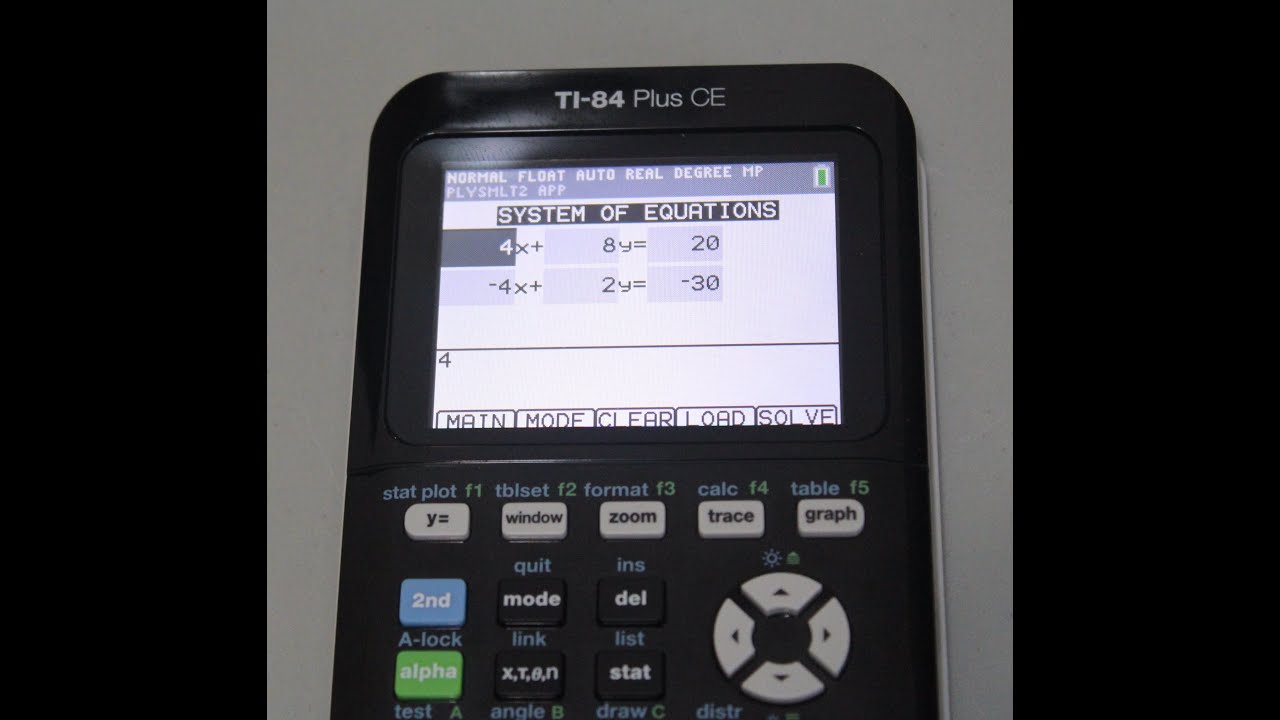
How to Solve Systems of Equations on TI-84 Plus CE and TI-84 Plus Silver Edition
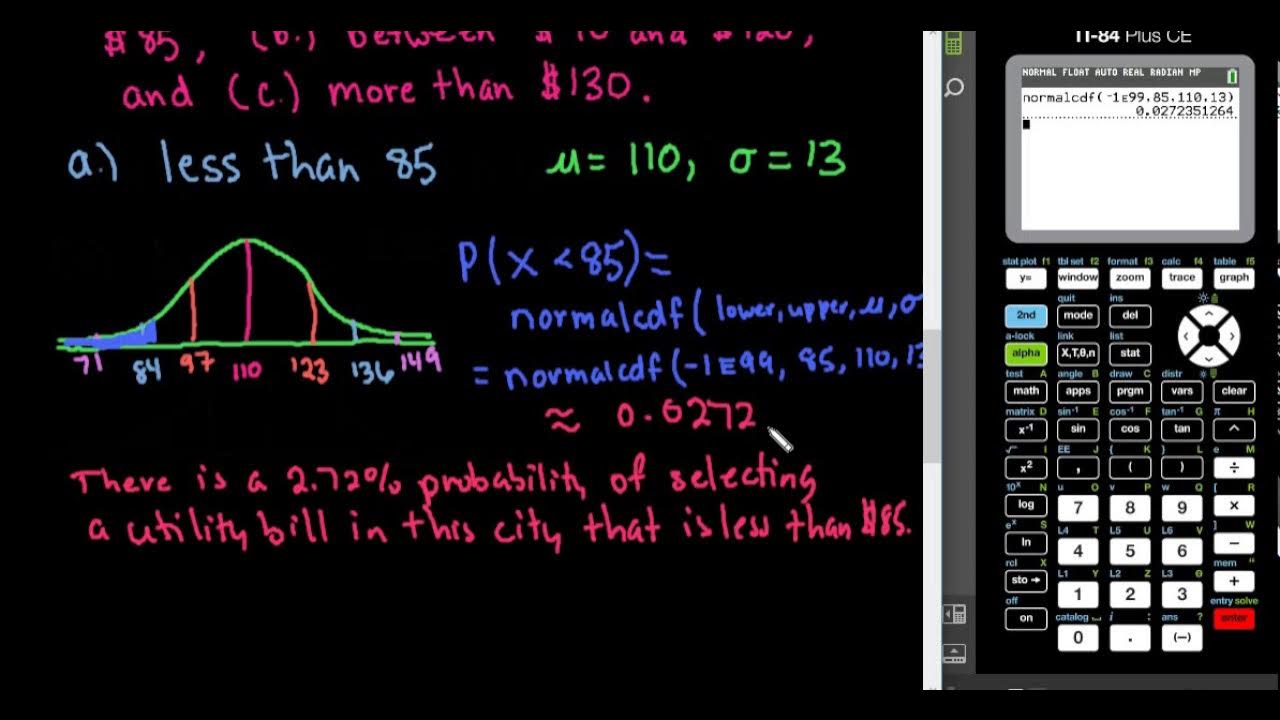
Probabilities in a Normal Distribution - TI-84

Finding Limits Numerically with a TI-84 Calculator

Calculus - Finding the derivative at a point using a Ti-83 or 84 calcululator
5.0 / 5 (0 votes)
Thanks for rating: