Contour Lines
TLDRIn this AP Physics essentials video, Mr. Andersen introduces the concept of contour lines, which represent lines of equal elevation and gravitational potential energy. He uses a bowl filled with water and colored liquid to visually demonstrate how contour lines are created, showing how closely spaced lines indicate steep slopes and widely spaced lines indicate gentle slopes. The video also explains that contour lines never cross, reflecting the impossibility of having two elevations at the same point. The lesson sets the stage for an analogy to equipotential lines in electric fields, which will be explored in more detail in the next video.
Takeaways
- 🌐 The video discusses contour lines, which are lines of equal elevation and gravitational potential energy, as an analogy for equipotential lines in electric fields.
- 📚 Contour lines are primarily an earth science concept, but they are used in physics to explain electric fields in the next video.
- 🧊 Mr. Andersen demonstrates how to draw contour lines using an inverted bowl filled with water and colored liquid to show lines of equal elevation.
- 📏 Contour lines are used to represent scalar fields, such as elevation on a topographical map, making it easier to visualize and understand the data.
- 🚫 Contour lines never cross each other because a location cannot have two different elevations simultaneously.
- 📈 The spacing of contour lines indicates the steepness of the terrain; closely spaced lines indicate steep slopes, while widely spaced lines indicate gentle slopes.
- 🏞 Contour lines are used on topographical maps to show layers of equal elevation, which can also represent areas of equal gravitational potential energy.
- 📊 A topographic profile is created by plotting the elevations from contour lines onto a grid with elevation on the y-axis and distance on the x-axis.
- 🔍 By examining contour lines on a map, one can build a three-dimensional mental picture of the terrain's shape and slope.
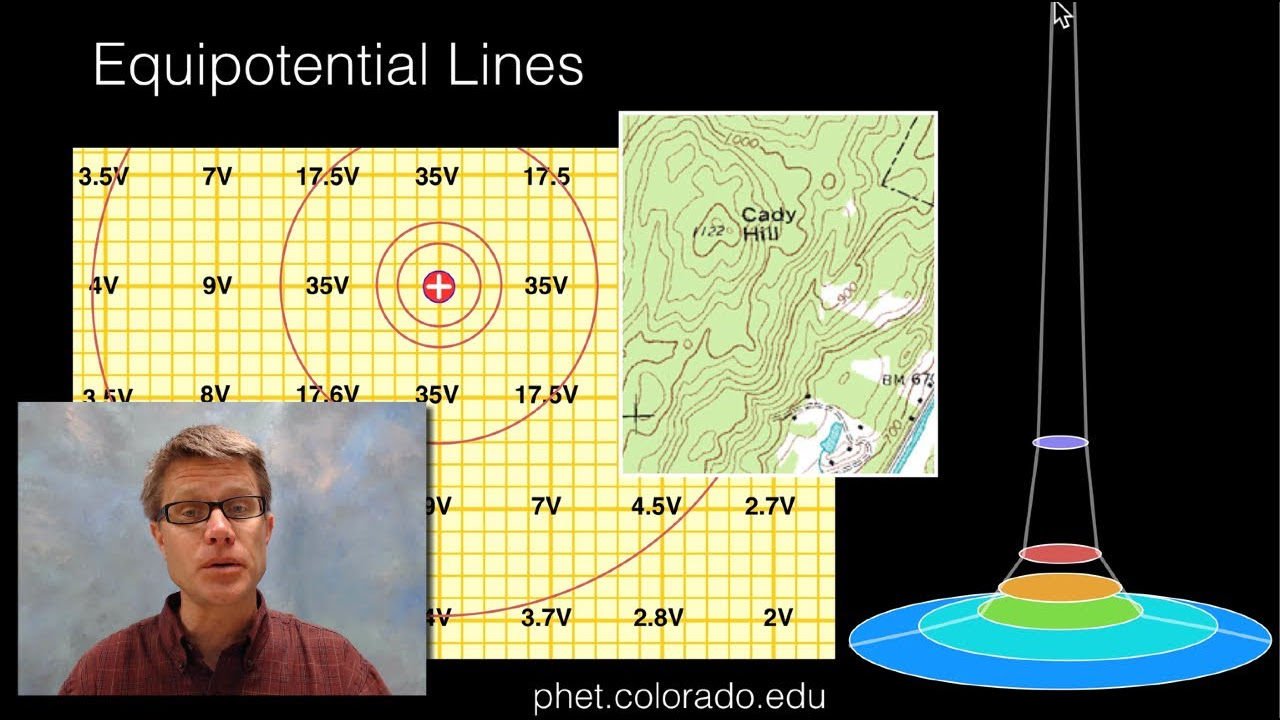
- 🔌 The concept of contour lines will be applied to electric fields, where equipotential lines represent areas of equal electric potential around charges.
- 📝 The video script aims to help viewers understand how to represent contour lines as isolines and how they relate to both gravitational and electric potential energy.
Q & A
What is the main topic of the video?
-The main topic of the video is contour lines, which are lines of equal elevation and therefore lines of equal gravitational potential energy. The concept is used as an analogy for equipotential lines in electric fields.
Why are contour lines important in earth science?
-Contour lines are important in earth science because they represent areas of equal elevation, which helps in understanding the topography of the land and can be used to measure gravitational potential energy.
What is an analogy used in the video to explain contour lines?
-The video uses an inverted bowl filled with water and colored liquid to visually demonstrate how contour lines represent areas of equal elevation.
How does the video demonstrate the creation of contour lines?
-The video demonstrates the creation of contour lines by filling an inverted bowl with water and colored liquid, then tracing where the water hits the bowl to mark lines of equal elevation.
What can be inferred about the steepness of a slope from the contour lines?
-When contour lines are close together, it indicates a steep slope, whereas when they are far apart, it indicates a gentler slope or a flatter area.
Why do contour lines never cross each other?
-Contour lines never cross each other because a single area cannot have two different elevations at the same time, ensuring that each line represents a unique elevation.
What is the purpose of the contour interval on a topographic map?
-The contour interval on a topographic map indicates the vertical distance between each contour line, helping to understand the elevation changes across the map.
How can a topographic profile be created using contour lines?
-A topographic profile can be created by drawing a line through the middle of the hill on the contour map and projecting each elevation onto a grid with elevation on the y-axis and distance on the x-axis.
What is the relationship between contour lines and gravitational potential energy?
-The farther away from the center of the Earth, the more gravitational potential energy an object has. Contour lines, showing areas of equal elevation, can be used to measure this energy.
How does the video relate contour lines to electric fields?
-The video relates contour lines to electric fields by using the concept of equal potential lines, where areas of equal gravitational potential energy are analogous to areas of equal electric potential.
What is the significance of the three-dimensional map shown in the video?
-The three-dimensional map shown in the video helps visualize the topography represented by the contour lines, providing a clear understanding of the elevation changes and their relation to gravitational potential energy.
Outlines
🌋 Introduction to Contour Lines and Gravitational Potential Energy
In this segment, Mr. Andersen introduces the concept of contour lines, which are lines of equal elevation on a landscape, and he uses a bowl filled with water to visually demonstrate how these lines are created. The video explains that contour lines are used in earth science to represent areas of equal gravitational potential energy. As the water level rises, the lines drawn on the bowl's surface represent different elevations, and the spacing between these lines indicates the steepness of the slope. The video also emphasizes that contour lines never cross, as a location cannot have two different elevations simultaneously. This concept will be used as an analogy for equipotential lines in electric fields in the next video.
🔋 Analogy Between Contour Lines and Electric Potential Lines
This paragraph serves as a transition to the next video, where the concept of contour lines will be applied to electric fields. Mr. Andersen explains that just as contour lines represent areas of equal gravitational potential energy on a topographic map, equipotential lines will represent areas of equal electric potential around positive and negative charges. The video concludes by reinforcing the idea that understanding contour lines and their properties is essential for grasping the concept of equipotential lines, which will be the focus of the subsequent educational content.
Mindmap
Keywords
💡Contour Line
💡Equipotential Line
💡Gravitational Potential Energy
💡Scalar Field
💡Topographical Map
💡Elevation
💡Topographic Profile
💡Electric Field
💡Steepness
💡Isolines
Highlights
Introduction to contour lines as lines of equal elevation and gravitational potential energy.
Contour lines are used as an analogy for equipotential lines in electric fields.
Demonstration of drawing contour lines using an inverted bowl and water.
Explanation of how contour lines represent steepness and flatness in elevation.
Rule that contour lines never cross each other, indicating single elevation at any point.
Application of contour lines in understanding scalar fields and gravitational potential energy.
The concept of contour interval and its significance in topographic maps.
Technique to create a topographic profile by projecting contour lines onto a grid.
Visualization of steep and gradual slopes through the closeness or spacing of contour lines.
Three-dimensional interpretation of contour lines on a topographic map.
Identification of elevation points on a three-dimensional map using contour lines.
Transition from gravitational potential to electric potential using contour lines analogy.
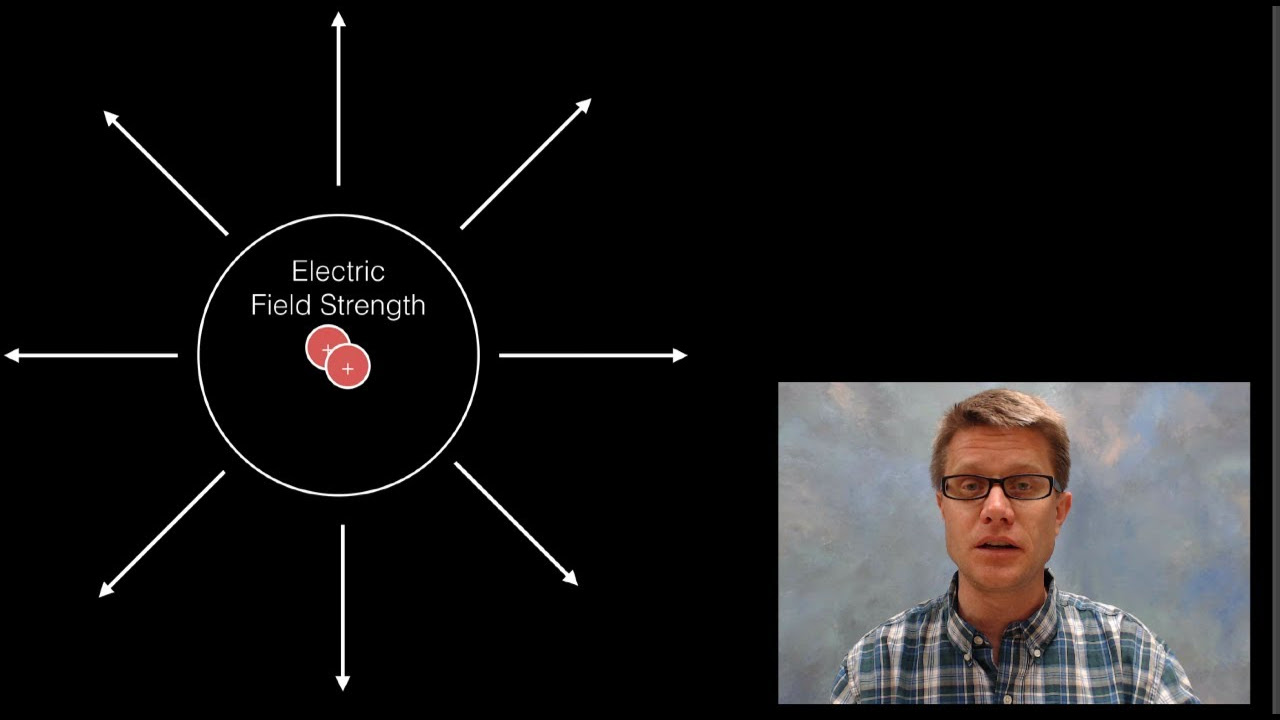
Representation of electric fields around positive and negative charges with equipotential lines.
Importance of understanding contour lines as isolines of equal gravitational energy.
Educational value of the video in teaching the concept of contour lines and their applications.
Transcripts


5.0 / 5 (0 votes)
Thanks for rating: