Average Value of the Electric Field
TLDRIn this AP Physics essentials video, Mr. Andersen uses the analogy of topographic maps and profiles to explain the concept of the average value of the electric field. He demonstrates how to visualize changes in elevation on Ayres Rock, Australia, using geocontext.org, and relates this to the concept of equipotential lines in an electric field. The video covers the calculation of electric field strength between parallel plates, both in uniform and non-uniform fields, by dividing the voltage difference by the displacement. It also addresses how to determine the average electric field strength and potential difference between two points, using the formula change in potential over displacement, and emphasizes the importance of understanding isolines for potential calculations.
Takeaways
- 📚 The video is an educational resource for AP Physics, focusing on the concept of the average value of the electric field.
- 🗺️ Mr. Andersen uses topographic maps and profiles as an analogy to explain electric fields, specifically referencing Ayres Rock in Australia.
- 🌐 The website geocontext.org is introduced as a tool to visualize changes in elevation, which parallels the concept of electric field strength.
- 📈 The script explains how to create a topographic profile to understand the changes in elevation, similar to understanding changes in electric potential.
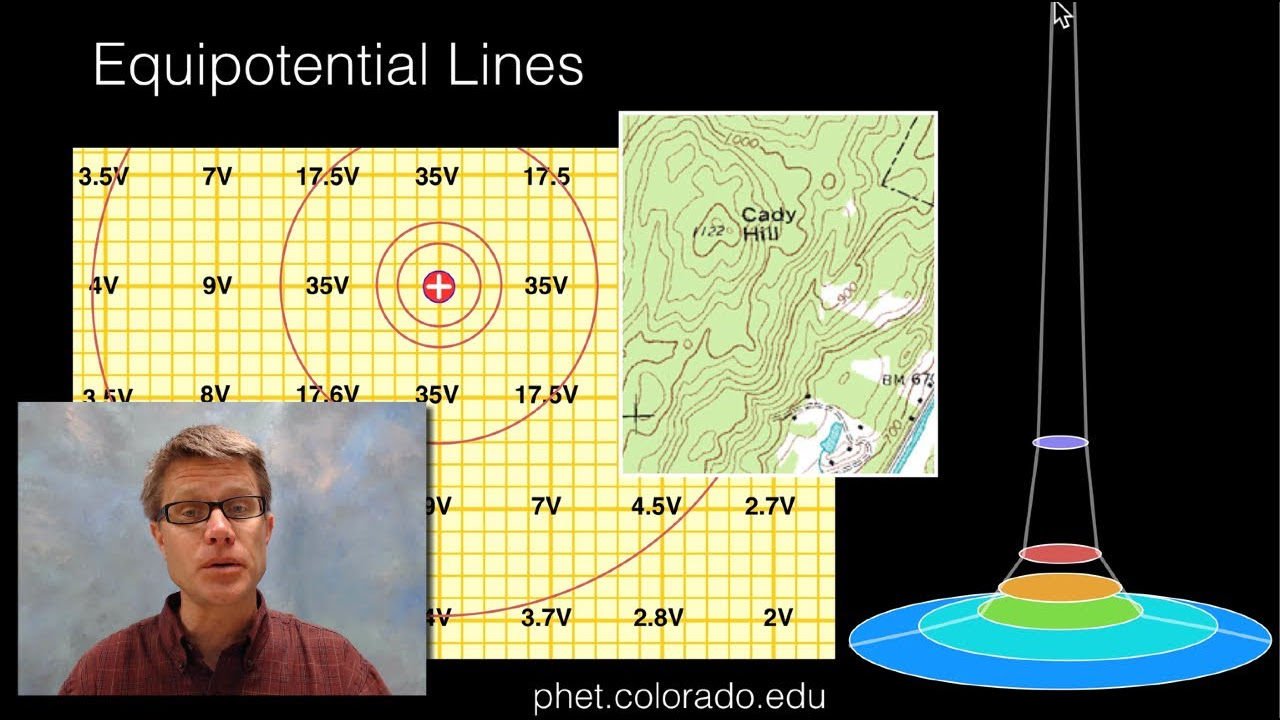
- 🔌 The concept of equipotential lines in an electric field is introduced, which are lines of equal electric potential, similar to contour lines on a map.
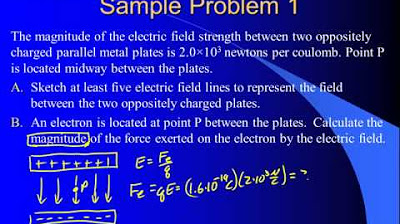
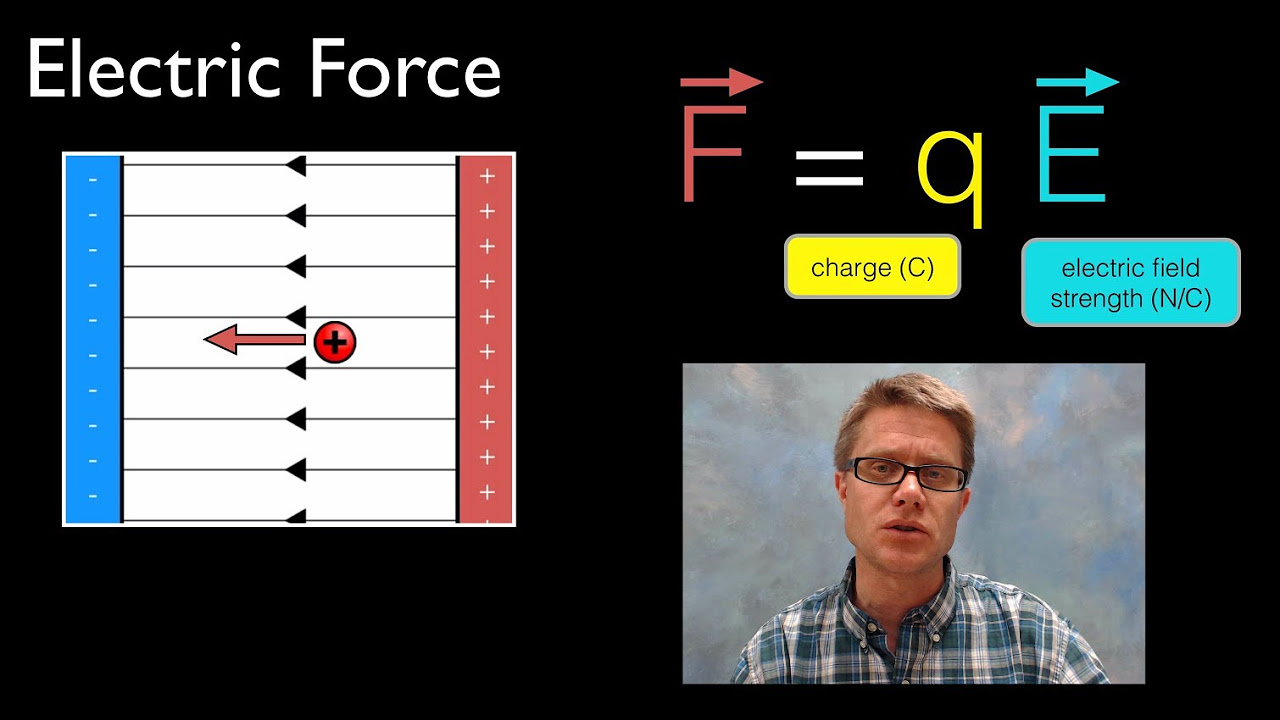
- ⚡ The electric field strength between two parallel plates is calculated by dividing the voltage by the distance between the plates.
- 📐 When the electric field is not uniform, the average field strength can be found by taking the potential difference and dividing it by the displacement.
- 🔢 The script provides a step-by-step example of how to calculate the average electric field strength using potential values and displacement.
- 🔍 The importance of understanding isolines (lines of equal potential) is highlighted, as moving along an isoline means no change in potential.
- 📘 The formula for calculating the average value of the electric field is reiterated, emphasizing its presence on the formula sheet for reference.
- 💡 The video concludes with a summary of the key learning points, encouraging viewers to ensure they understand how to calculate average values and use isolines.
Q & A
What is the main topic of the video?
-The main topic of the video is the average value of the electric field, using topographic maps and profiles as an analogy.
Why does Mr. Andersen use Ayres Rock in Australia as an example?
-Mr. Andersen uses Ayres Rock as an example to visually demonstrate the concept of contour lines and topographic profiles, which are used as an analogy to explain electric fields.
What is the purpose of the website geocontext.org in the context of the video?
-The geocontext.org website is used to show how one can create topographic profiles for any location on the planet, which helps in understanding the concept of equipotential lines in electric fields.
How does Mr. Andersen explain the relationship between the vertical and horizontal changes on a topographic profile?
-Mr. Andersen explains that the topographic profile shows how much the elevation changes vertically in relation to the horizontal, which is analogous to the electric field strength between two points.
What is an equipotential line in the context of electric fields?
-An equipotential line in an electric field is a line along which the electric potential is the same at every point, similar to contour lines on a topographic map.
How is the electric field strength calculated between two parallel plates with a uniform electric field?
-The electric field strength between two parallel plates with a uniform electric field is calculated by dividing the voltage across the plates by the distance between them.
What is the significance of the average field strength in the context of non-uniform electric fields?
-In non-uniform electric fields, where equipotential lines are not equally spaced, the average field strength is used to estimate the electric field strength between two points by finding the potential difference and dividing it by the displacement.
How does the concept of voltage relate to electric fields?
-Voltage is a measure of the work done to move a test charge from one place to another in an electric field, and it is used to calculate the electric field strength by dividing it by the displacement.
What is the formula used to calculate the electric field strength or electric potential between two points?
-The formula used to calculate the electric field strength or electric potential between two points is the change in voltage (or potential) divided by the change in displacement.
How can one determine the average value of the electric field between two points in a non-uniform field?
-To determine the average value of the electric field between two points in a non-uniform field, one can find the potential at the two points and divide the difference by the displacement between them.
Why would the difference in electric field strength or potential be zero when moving along an isoline?
-The difference in electric field strength or potential is zero when moving along an isoline because an isoline represents a constant level of potential, similar to how moving along a contour line on a topographic map does not change the elevation.
Outlines
📚 Introduction to Average Electric Field
Mr. Andersen introduces the concept of the average value of the electric field in this physics video. He uses topographic maps and profiles as analogies to explain how electric charges behave within an electric field. The video features Ayres Rock in Australia as an example, demonstrating how different areas can have varying elevations, similar to how electric fields can vary in strength. Mr. Andersen guides viewers through using geocontext.org to visualize topographic profiles and explains how to interpret these profiles to understand changes in elevation, which parallels understanding changes in electric potential.
Mindmap
Keywords
💡Electric Field
💡Average Value
💡Topographic Maps
💡Topographic Profiles
💡Equipotential Lines
💡Electric Potential
💡Voltage
💡Displacement
💡Geocontext.org
💡Isolines
Highlights
Introduction to the concept of the average value of the electric field in an AP Physics context.
Use of topographic maps and profiles as an analogy to understand electric fields.
Mention of Ayres Rock in Australia as a visual aid for understanding contour lines.
Introduction of geocontext.org for interactive topographic mapping.
Explanation of how to use geocontext.org to create topographic profiles.
Demonstration of how topographic profiles show changes in elevation.
Comparison of the top of Ayres Rock's profile to illustrate flatness.
Application of topographic profile analogy to electric potential and fields.
Description of equipotential lines and their relation to electric field strength.
Calculation method for electric field strength between parallel plates.
Introduction of the concept of average field strength in non-uniform fields.
Technique to find average electric field strength using potential differences.
Explanation of voltage as a measure of work done to move a test charge.
Calculation of electric field strength using voltage and displacement.
Example problem solving for calculating average electric potential difference.
Use of the y-axis for determining displacement in potential difference calculations.
Clarification on the zero difference in electric field when moving along an isoline.
Summary of the formula for calculating the average value and its presence on the formula sheet.
Instruction on using isolines to determine potential at different areas.
Transcripts

5.0 / 5 (0 votes)
Thanks for rating: