Constrained optimization introduction
TLDRIn the upcoming videos, the instructor introduces the concept of Constrained Optimization, using the example of maximizing the function f(x,y) = x^2 * y under the constraint x^2 + y^2 = 1, which forms a unit circle. The instructor explains the visualization of the problem by graphing the function and its constraints, and suggests using contour lines to find the maximum value of the function within the circle. The key insight is that the maximum occurs at the point of tangency between the contour line and the circle, a concept that will be explored further in the next video.
Takeaways
- 📚 The video discusses Constrained Optimization problems, where you maximize or minimize a function subject to certain constraints.
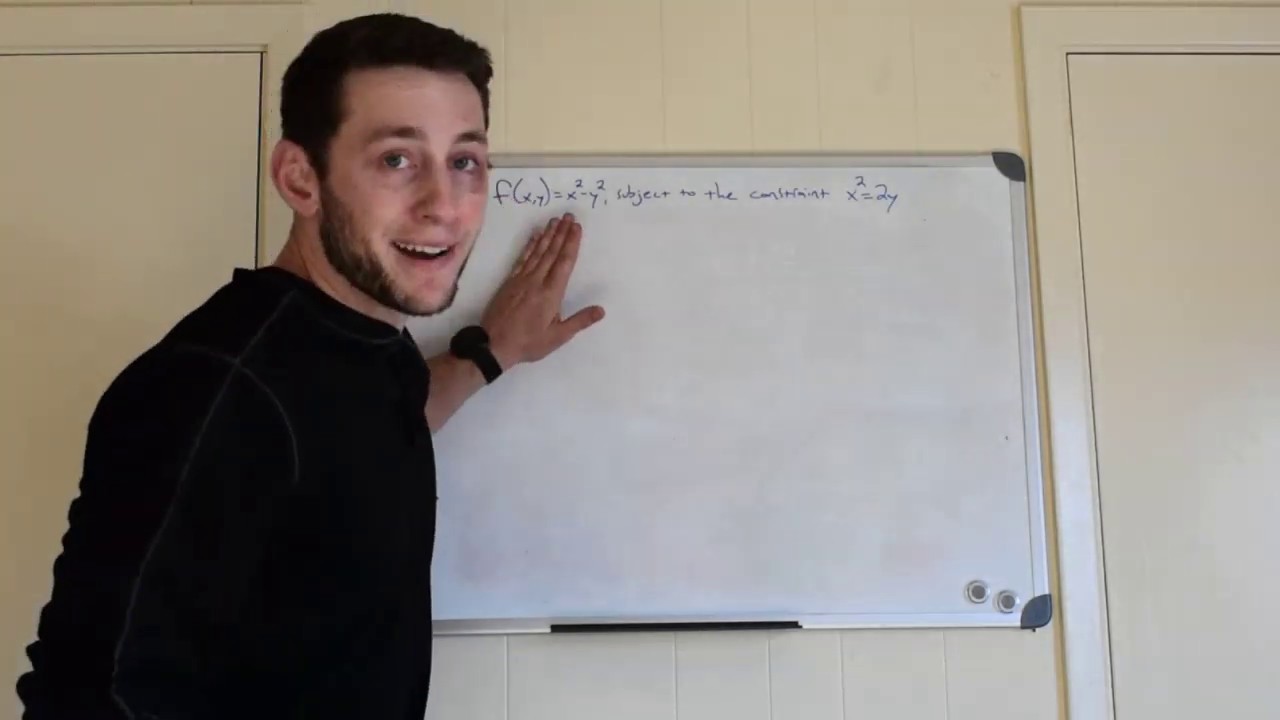
- 🔍 An example given is maximizing the function f(x,y) = x^2 * y with the constraint x^2 + y^2 = 1, which represents the unit circle.
- 📈 The instructor suggests visualizing the problem by graphing the function and projecting the constraint set onto the graph.
- 📊 Contour lines are introduced as a method to represent constant values of the function f(x,y), which are crucial for understanding the problem.
- 🔬 The instructor emphasizes the importance of understanding contour lines and suggests reviewing a related video for clarity.
- 🔄 The concept of varying the constant in the function to observe changes in the contour lines is introduced to find intersections with the constraint.
- 🔲 It is highlighted that only certain contour lines intersect with the constraint circle, indicating achievable function values under the constraint.
- 📍 The maximum value of the function that can be achieved subject to the constraint is where the contour line is tangent to the constraint circle.
- 🤔 The instructor prompts viewers to consider how the concept of tangency and the gradient from multi-variable calculus can be applied to solve the problem.
- 👀 The script encourages viewers to think about the problem and the mathematical concepts involved before the next video, which will delve into the solution.
- 🔑 The key takeaway is the use of tangency between the contour line and the constraint circle to find the maximum value of the function within the given constraint.
Q & A
What is a Constrained Optimization problem?
-A Constrained Optimization problem is an optimization problem where you are asked to maximize or minimize a function subject to certain constraints, which limit the values of variables you can use.
What is the function given as an example in the script?
-The example function given in the script is f(x, y) = x^2 * y, which is a multi-variable function.
What is the constraint set described in the script?
-The constraint set described in the script is the set of all values of x and y such that x^2 + y^2 equals one, which represents the unit circle in the xy-plane.
How does the script suggest visualizing the problem?
-The script suggests visualizing the problem by first considering the graph of the function and then looking at the constraint as a subset of the xy-plane, represented as a circle.
What is the significance of the contour lines in the script's explanation?
-Contour lines represent constant values of the function f(x, y). They are crucial for understanding how the function behaves across different regions of the xy-plane and how it intersects with the constraint set.
Why are the contour lines important for solving the optimization problem?
-The contour lines are important because they help identify where the function intersects with the constraint set, which is necessary for finding the maximum or minimum values of the function within the given constraints.
What does the script suggest as the best way to visualize the solution to the problem?
-The script suggests that the best way to visualize the solution is to look at the contour lines in the xy-plane, rather than trying to graph things in three dimensions.
What is the concept of tangency mentioned in the script?
-Tangency refers to the condition where the contour line of the function is just touching the constraint set (the unit circle) at a single point, which is a critical observation for finding the maximum value of the function under the constraint.
How does the script hint at using the gradient to solve the problem?
-The script hints at using the gradient by suggesting that the maximum value of the function occurs when the contour line is tangent to the constraint set, which is a condition that can be analyzed using the gradient of the function.
What is the main insight the script wants the viewer to take away before the next video?
-The main insight the script wants the viewer to consider is the concept of tangency and how it can be used along with other multi-variable calculus concepts, such as the gradient, to solve the optimization problem.
Outlines
📚 Introduction to Constrained Optimization
The instructor introduces the concept of constrained optimization, using the example of maximizing a multi-variable function, f(x, y) = x^2 * y, subject to the constraint x^2 + y^2 = 1, which forms the unit circle. The instructor suggests visualizing the problem by first graphing the function and then considering the constraint as a subset of the x, y plane. The goal is to find the highest points on the projected circle within the graph of the function. The instructor also mentions a better way to visualize the problem by focusing on the x, y plane and using contour lines to represent constant values of the function, which will be explained in more detail in the next video.
🔍 Maximizing Function with Tangency to Constraint
In this paragraph, the instructor discusses the process of maximizing the given function under the constraint by using contour lines to find the maximum achievable value of the function. The instructor explains that the maximum value is reached when the contour line representing the function's value is tangent to the constraint circle. The instructor guides the viewer to consider how to use the concept of tangency and other multi-variable calculus concepts, such as the gradient, to solve the optimization problem. The video ends with a teaser for the next video, where the instructor will delve into the details of using tangency to find the exact values of x and y that maximize the function within the given constraint.
Mindmap
Keywords
💡Constrained Optimization
💡Multi-variable Function
💡Unit Circle
💡Graph
💡Contour Lines
💡Tangency
💡Gradient
💡Maximize
💡Constraint
💡Intersection
Highlights
Introduction to Constrained Optimization problems.
Example of maximizing a multi-variable function with constraints.
Function f(x,y) = x^2 * y is introduced as an example.
Constraint set defined by x^2 + y^2 = 1, representing the unit circle.
Visualizing the problem by graphing the function and constraint.
Concept of projecting the constraint onto the function's graph.
Explanation of looking for the highest points on the projected circle.
Introduction of a better visualization method using the x,y plane.
Discussion of contour lines for the function f(x,y) = x^2 + y^2.
Importance of understanding contour lines for solving the problem.
Zooming in on a specific contour line to analyze its intersection with the constraint.
Illustration of how different constant values affect contour line intersections.
Observation that the maximum value of the function cannot exceed the constraint.
Demonstration of how to find the maximum achievable value of the function.
Key observation that the maximum occurs when the contour line is tangent to the constraint.
Teaser for the next video on using tangency to solve the optimization problem.
Encouragement for viewers to consider how to apply concepts like the gradient to solve the problem.
Transcripts
Browse More Related Video

Lagrange multipliers, using tangency to solve constrained optimization

Finishing the intro lagrange multiplier example
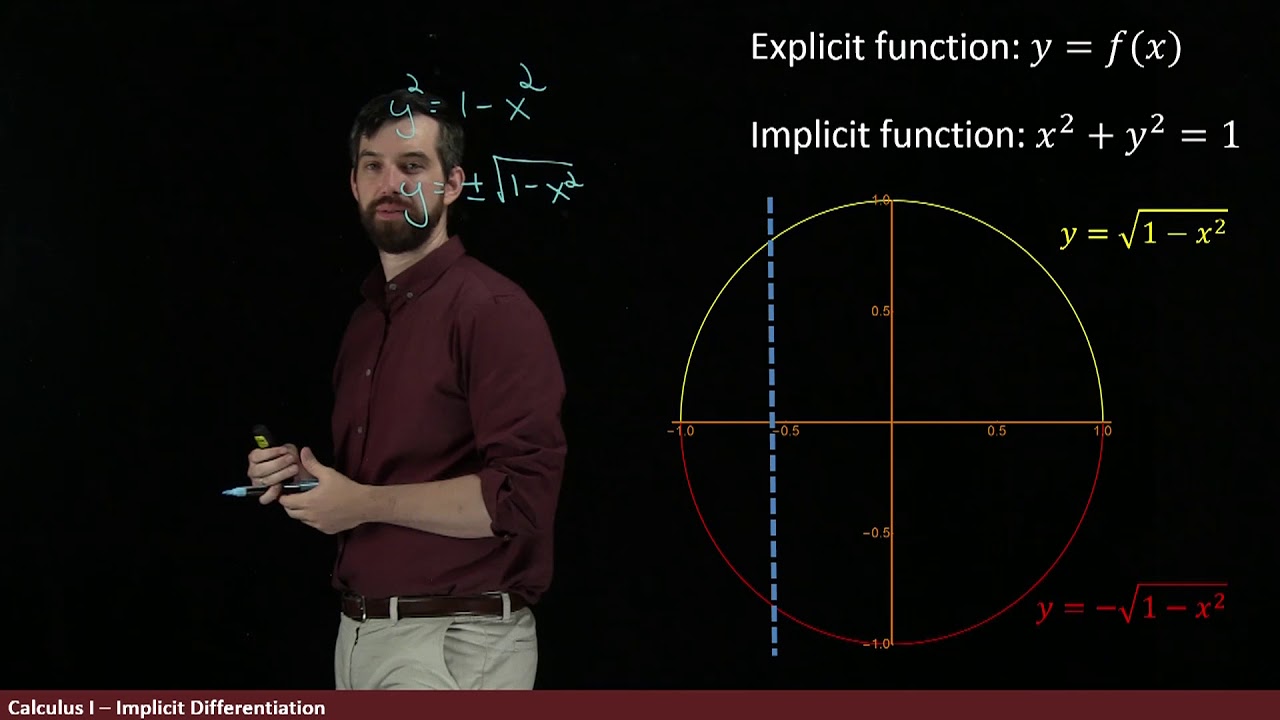
Implicit Differentiation | Differentiation when you only have an equation, not an explicit function

Managerial Economics 1.2: Univariate Optimization

Implicit differentiation | Advanced derivatives | AP Calculus AB | Khan Academy
Lagrange Multiplier Example
5.0 / 5 (0 votes)
Thanks for rating: