Intervals where the Function is Increasing, Decreasing, or Constant
TLDRThis educational video teaches viewers how to interpret and notate intervals on a graph based on whether the graph is increasing, decreasing, or constant. The instructor uses five examples to demonstrate the process, emphasizing the importance of not including endpoints where the graph changes direction. Key concepts include identifying positive and negative slopes and recognizing horizontal lines. The video also promotes the instructor's video courses on Algebra, which cover additional connecting concepts not typically found in free online resources.
Takeaways
- 📚 The video teaches how to write interval notation based on whether a graph is increasing, decreasing, or constant.
- 📈 Increasing graphs are like reading a book from left to right, indicating a positive slope or upward trend.
- 📉 Decreasing graphs are like going downhill, showing a negative slope or downward trend.
- 🏁 Constant graphs are represented by a horizontal line, indicating a slope of zero.
- ❗ Remember not to include endpoints in interval notation because they represent changes in the graph's behavior.
- 🔍 Analyze the graph from left to right to determine the intervals of increasing, decreasing, and constant behavior.
- 🚫 At points where the graph changes from increasing to decreasing or vice versa, these points should not be included in the intervals.
- 🔑 Use open intervals to denote the ranges where the graph is increasing or decreasing, and specify 'none' where the graph is constant.
- 🤔 The script encourages viewers to practice by trying examples on their own and watching additional videos for more practice.
- 🛒 The speaker offers video courses for sale that cover Algebra 1, Algebra 2, and other topics, emphasizing the importance of understanding connecting concepts.
- 🚗 An analogy of driving a car is used to help visualize the concept of increasing and decreasing graphs.
Q & A
What does it mean for a graph to be increasing?
-A graph is increasing when, as you read from left to right, the graph moves upwards, indicating a positive slope or direction.
How is a decreasing graph represented?
-A graph is decreasing when it moves downwards as you read from left to right, which signifies a negative slope.
What does a constant graph look like?
-A constant graph is represented by a horizontal line, indicating a slope of zero.
Why should endpoints not be included in interval notation when describing the behavior of a graph?
-Endpoints should not be included because they represent points where the graph's behavior changes, such as from increasing to decreasing or vice versa.
In interval notation, how do you denote an increasing graph from negative infinity to a certain point?
-You use an open interval notation, such as 'from negative infinity to x', and you do not include the endpoint.
What is the interval notation for a graph that is decreasing from a certain point to positive infinity?
-The interval notation would be 'from x to positive infinity', using an open interval to exclude the starting point.
How do you represent multiple increasing intervals on a graph?
-You use a union symbol (U) to combine the intervals, such as 'from negative infinity to x1 U from x2 to positive infinity'.
What is an example of a mistake students often make when identifying decreasing intervals?
-Students sometimes look at the Y values instead of the X values to determine where the graph is decreasing, which can lead to incorrect interval notation.
How can the concept of driving a car be used as an analogy to understand graph behavior?
-Just as a car moves uphill (increasing) or downhill (decreasing), the graph's direction can be visualized similarly when moving from left to right.
What are asymptotes, and how do they affect the graph's behavior?
-Asymptotes are lines that a graph approaches but never touches or crosses. They can affect the graph's behavior by limiting how far it can extend in certain directions.
What does the instructor suggest for further practice on identifying increasing, decreasing, and constant intervals on a graph?
-The instructor suggests watching another video they made on the same concept for more practice, explanations, and to test understanding.
Outlines
📚 Understanding Graph Behavior in Interval Notation
This paragraph introduces the concept of interval notation in relation to the behavior of a graph, which can be increasing, decreasing, or constant. The instructor explains that an increasing graph is analogous to reading a book from left to right, where the graph ascends, indicating a positive slope. A decreasing graph is likened to going downhill, with a negative slope. A constant graph is represented by a horizontal line, indicating a slope of zero. The key takeaway is to not include endpoints in interval notation when the graph transitions from one behavior to another, as these points represent changes in direction. The paragraph sets the stage for five examples that will illustrate these concepts.
📈 Analyzing Graph Behavior with Interval Notation Examples
The paragraph continues with an interactive approach, engaging viewers to analyze the behavior of a graph in interval notation. It provides a step-by-step guide on how to determine whether a graph is increasing, decreasing, or constant by scanning from left to right. The instructor uses visual aids like arrows and horizontal lines to represent the graph's behavior and emphasizes the importance of open intervals to exclude points where the graph's behavior changes. The paragraph includes examples with specific x-values where the graph is increasing, decreasing, or constant, and it invites viewers to practice with additional examples on their own.
Mindmap
Keywords
💡Interval Notation
💡Increasing
💡Decreasing
💡Constant
💡Slope
💡End Points
💡Open Interval
💡Graph
💡Vertical Asymptote
💡Union
Highlights
Introduction to writing interval notation for increasing, decreasing, and constant graphs.
Explanation of increasing graph as having a positive slope, not necessarily constant.
Decreasing graph described as going downhill with a negative slope.
Constant graph is represented by a horizontal line with a slope of zero.
Important rule: Do not include endpoints when the graph changes behavior.
Demonstration of identifying increasing intervals on a graph.
Example of how to denote increasing from negative infinity to a certain point.
Explanation of identifying decreasing intervals on a graph.
Method to denote decreasing from a point to positive infinity with open intervals.
Clarification on identifying constant intervals and their notation.
Second example graph analysis with increasing, decreasing, and constant intervals.
Instruction on working from left to right and low to high for interval identification.
Third example graph with challenges in identifying intervals.
Explanation of using a union to combine multiple increasing intervals.
Emphasis on avoiding mistakes by focusing on x-values for decreasing intervals.
Invitation for viewers to practice with additional examples.
Promotion of video courses for further learning and understanding.
Use of driving analogy to help understand increasing and decreasing intervals.
Final examples with vertical asymptotes and their impact on interval notation.
Encouragement for viewers to follow to another video for more practice.
Transcripts
Browse More Related Video

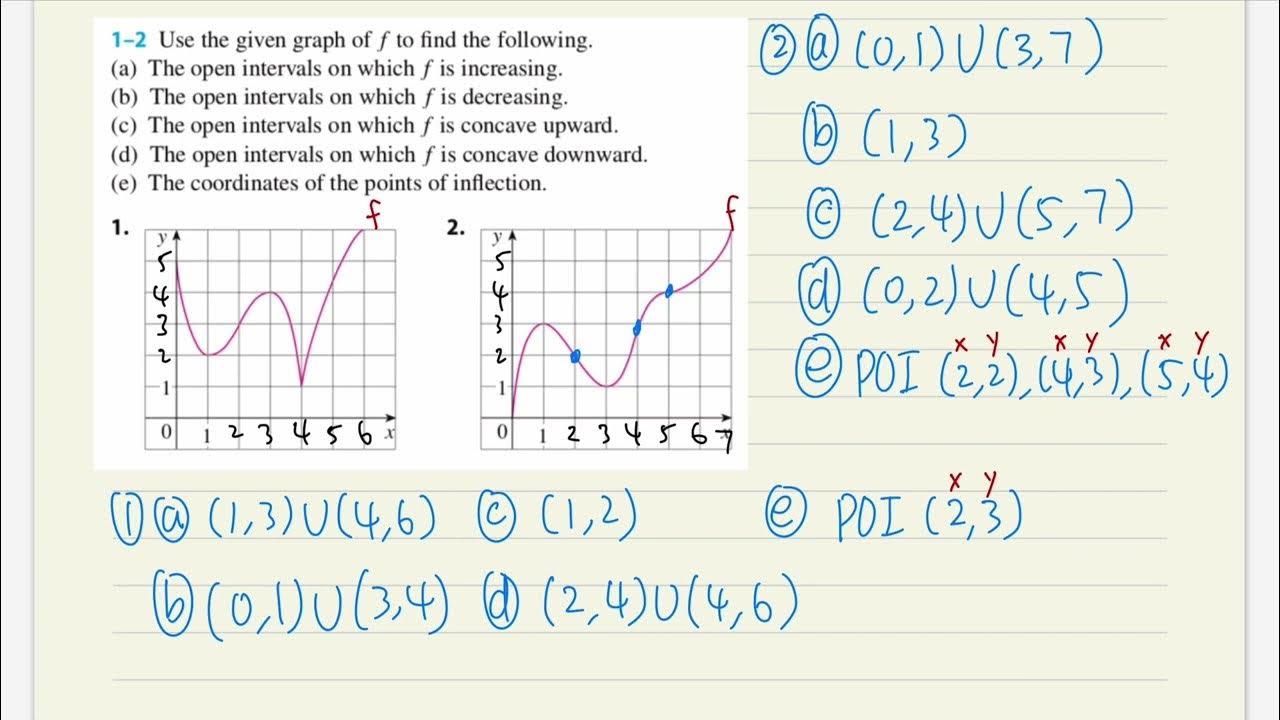
Where is the function increasing, decreasing, concave up, concave down, and points of inflection?

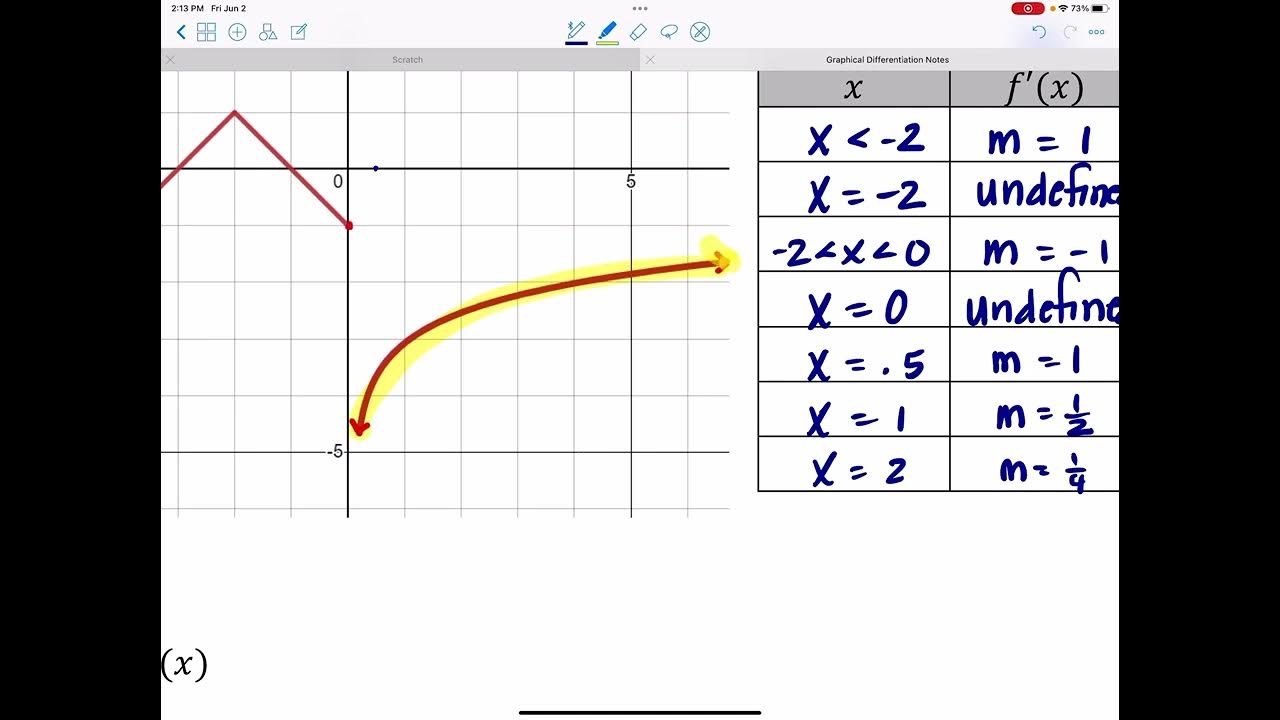
Graphical Differentiation

Graphs of f, f prime, and f double prime

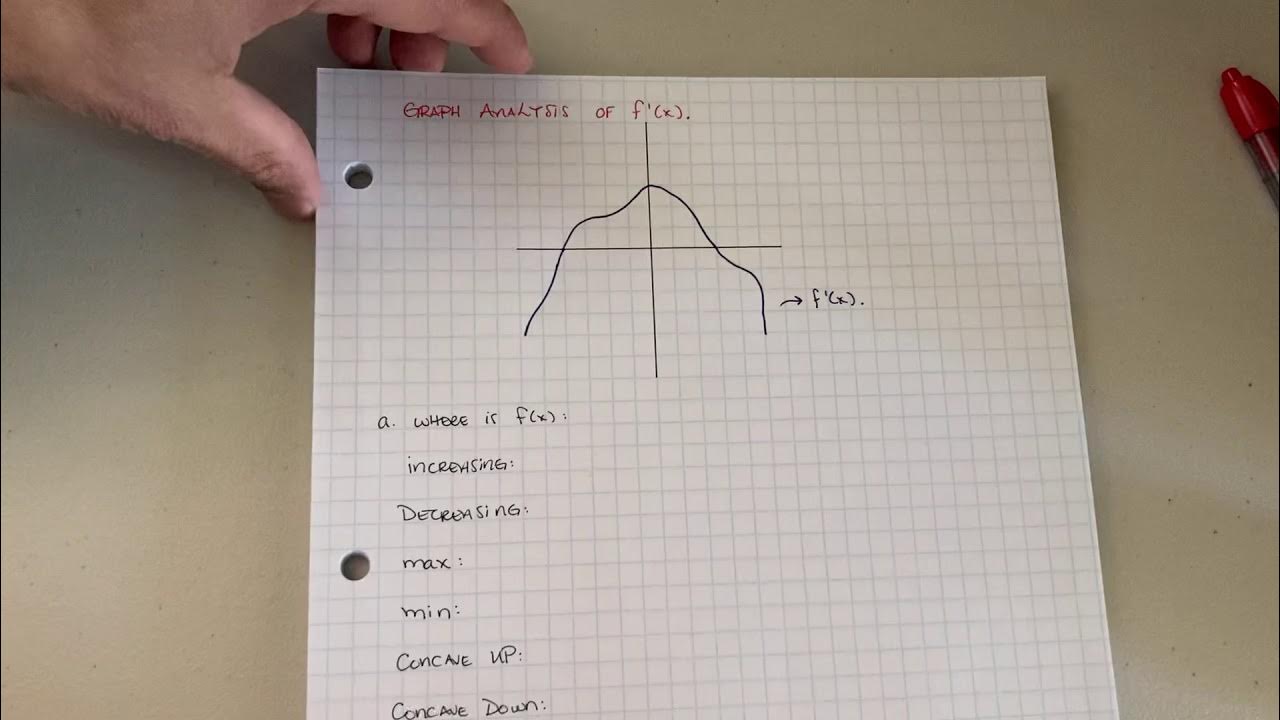
AP Calculus AB: Analyzing the Graph of the first Derivative

What the Second Derivative Tells You about a Graph

Properties of Functions - Extrema (Precalculus - College Algebra 10)
5.0 / 5 (0 votes)
Thanks for rating: