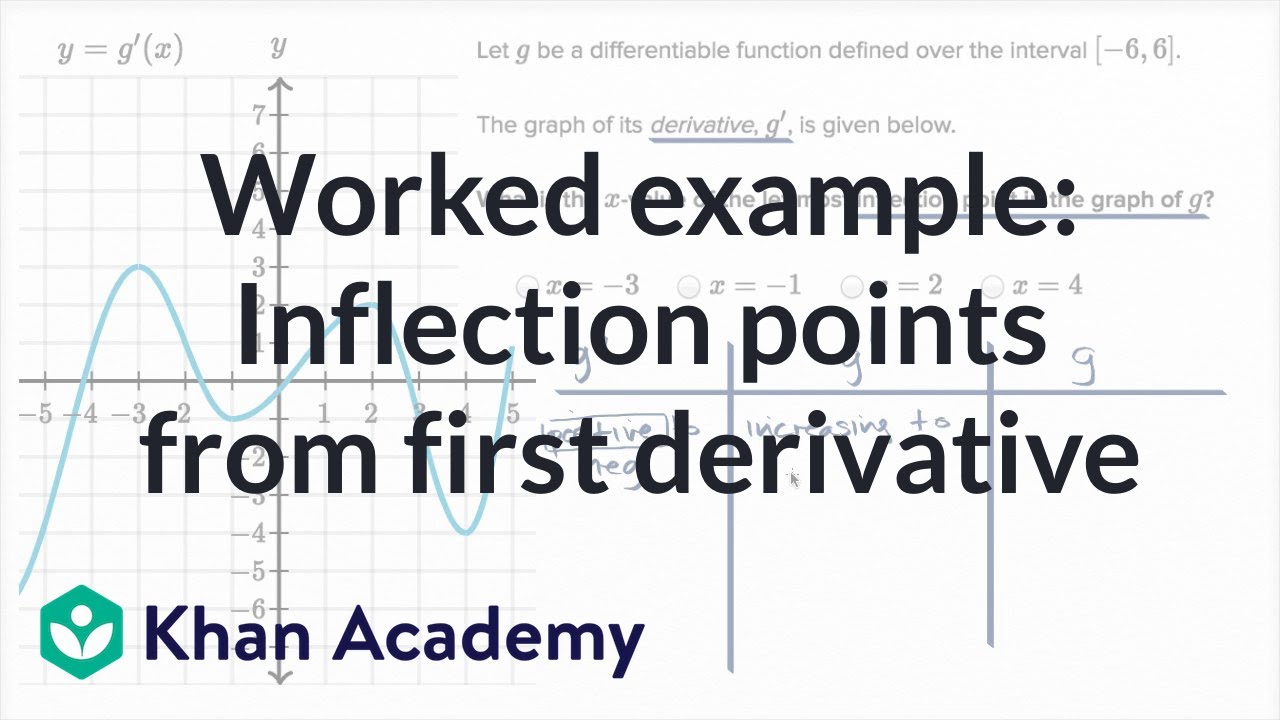
AP Calculus AB: Analyzing the Graph of the first Derivative
TLDRThis video script offers a clear guide to understanding the concept of derivatives on the AP exam. It explains how to determine where a function is increasing or decreasing by analyzing the slopes represented on a graph, identifying the intervals from negative 4 to positive 3 as increasing and from negative 6 to negative 4 and from 3 to 5 as decreasing. The script also teaches viewers how to spot a maximum at x=3 and a minimum at x=-4 by looking at the change in slopes. Further, it discusses concavity, pointing out that the graph is concave up from x=-6 to 0 and concave down from 0 to 5, and identifies a point of inflection at x=0. The explanation aims to help students grasp the significance of derivatives and their applications in calculus.
Takeaways
- 📈 The video is a tutorial on analyzing the graph of the derivative function, f'(x), which is a common topic on the AP exam.
- 📊 To determine where the original function f(x) is increasing, look for where the derivative's slopes are positive, specifically from negative 4 to positive 3 in the given example.
- 📉 Conversely, f(x) is decreasing where the slopes of the derivative are negative, which is from negative 6 to negative 4 and from 3 to 5 in the example.
- 🔍 The maximum point of f(x) can be identified where the derivative changes from negative to positive slopes, which is at x equals 3 in this case.
- 🔎 The minimum point is where the derivative changes from positive to negative slopes, occurring at x equals negative 4.
- 📚 Concavity is related to the second derivative, and the graph is concave up where the slope of the derivative is increasing, from negative 6 to 0 in the example.
- 📝 The graph is concave down where the slope of the derivative is decreasing, which is from 0 to 5 in the provided graph.
- 🔄 A point of inflection occurs where the second derivative (the derivative of the derivative) is equal to zero, at x equals 0 in this scenario.
- 🤓 Understanding the behavior of the derivative graph is crucial for grasping a significant part of calculus concepts.
- 📌 The video emphasizes the importance of recognizing the relationship between the derivative's graph and the original function's increasing/decreasing behavior, as well as its concavity and points of inflection.
- 👍 The presenter encourages viewers to keep working hard, indicating the value of persistence in mastering calculus concepts.
Q & A
What is the main topic of the video?
-The main topic of the video is analyzing the graph of f'(x), which is the derivative of a function, in the context of the AP exam.
What is the significance of the derivative in the context of the video?
-The derivative, denoted as f'(x), is significant as it represents the slope of the tangent to the curve at any given point, and it helps in determining where the original function is increasing or decreasing.
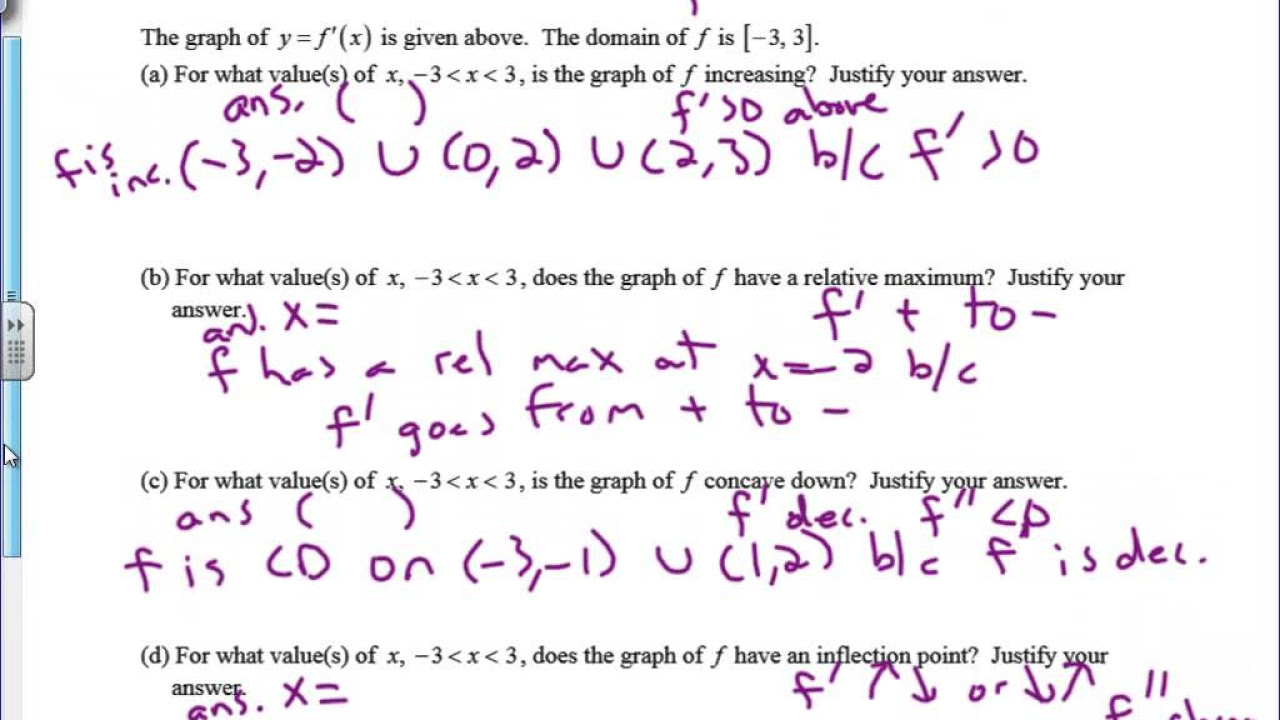
How can you determine where the function f(x) is increasing from the derivative graph?
-The function f(x) is increasing where the derivative graph, f'(x), is above the x-axis, indicating positive slopes.
What is the range of x values for which the function f(x) is increasing according to the video?
-The function f(x) is increasing from x = -4 to x = 3.
How can you identify where the function f(x) is decreasing from the derivative graph?
-The function f(x) is decreasing where the derivative graph, f'(x), is below the x-axis, indicating negative slopes.
What are the x values that indicate the function is decreasing according to the video?
-The function is decreasing from x = -6 to x = -4 and from x = 3 to x = 5.
What does a change from negative to positive slopes on the derivative graph indicate?
-A change from negative to positive slopes on the derivative graph indicates a local minimum.
What is the x-coordinate of the local maximum according to the video?
-The local maximum occurs at x = 3.
What is the x-coordinate of the local minimum according to the video?
-The local minimum occurs at x = -4.
What is the concept of concavity in the context of the derivative graph?
-Concavity refers to the curvature of the graph, and in the context of the derivative graph, it is determined by the second derivative, which is the derivative of f'(x).
How can you determine where the graph is concave up from the derivative graph?
-The graph is concave up where the second derivative (the slope of the derivative) is increasing, which is from x = -6 to x = 0 in the video.
How can you determine where the graph is concave down from the derivative graph?
-The graph is concave down where the second derivative is decreasing, which is from x = 0 to x = 5 in the video.
What is a point of inflection and how can you find it from the derivative graph?
-A point of inflection is a point on the graph where the concavity changes. It can be found from the derivative graph where the second derivative is equal to zero, which in the video occurs at x = 0.
Outlines
📈 Understanding the Derivative Graph for AP Exam
This paragraph introduces the topic of analyzing the graph of the derivative function, f'(x), on the AP exam. The speaker explains the importance of understanding where the original function f(x) is increasing or decreasing by examining the slopes represented on the derivative graph. The slopes above the x-axis indicate where the function is increasing, while those below indicate a decrease. The speaker also discusses how to identify maximum and minimum points by looking at the transition from negative to positive slopes and vice versa.
📉 Identifying Maximum and Minimum Points on the Derivative Graph
The speaker continues by focusing on how to find the maximum and minimum points of the original function from its derivative graph. A maximum is identified where the slope transitions from negative to positive, indicating the function is going up after going down. Conversely, a minimum is where the slope goes from positive to negative. The specific x-values for the maximum and minimum points are given as x equals 3 for the maximum and x equals -4 for the minimum.
📚 Analyzing Concavity with the Second Derivative
The paragraph delves into the concept of concavity, which is determined by the second derivative or the slope of the derivative. The speaker explains that if the slope of the derivative is increasing, the graph is concave up, and if it's decreasing, the graph is concave down. The speaker identifies the intervals of concavity by observing the direction of the slope changes in the derivative graph, concluding that the graph is concave up from x equals -6 to 0 and concave down from 0 to 5.
🔍 Locating Points of Inflection on the Derivative Graph
The final part of the script addresses the identification of points of inflection, which occur where the derivative equals zero, indicating a horizontal tangent. The speaker explains that a point of inflection is where the concavity changes, and in the given function, it is located at x equals 0. The summary concludes with encouragement for students to continue working hard and a sign-off for the next session.
Mindmap
Keywords
💡Derivative
💡Increasing Function
💡Decreasing Function
💡Slope
💡Max
💡Min
💡Concavity
💡Second Derivative
💡Point of Inflection
💡AP Exam
💡Tangent
Highlights
Introduction to analyzing the graph of f'(x) on the AP exam.
Explanation of the derivative as slopes of the original function.
Identifying where f(x) is increasing by looking at positive slopes above the x-axis.
The function f(x) increases from negative 4 to positive 3.
Determining where f(x) is decreasing by observing negative slopes below the x-axis.
The function f(x) decreases from negative 6 to negative 4 and from 3 to 5.
Identifying the maximum point of the function at x equals 3.
Finding the minimum point of the function at x equals negative 4.
Understanding concavity as the second derivative of the function.
Graph is concave up from negative 6 to 0, indicated by increasing slopes of the derivative.
Graph is concave down from 0 to 5, shown by decreasing slopes of the second derivative.
Locating the point of inflection at x equals 0 where the derivative equals zero.
The significance of the point of inflection as a horizontal tangent.
Encouragement to keep working hard and understanding the concept of derivatives.
The practical application of understanding derivatives for the AP exam.
The importance of recognizing increasing and decreasing functions in calculus.
The role of concavity in analyzing the shape of the graph of a function.
The method to identify maximum and minimum points on a graph.
The concept of a point of inflection as a change in the concavity of a graph.
Transcripts
Browse More Related Video


5.0 / 5 (0 votes)
Thanks for rating: