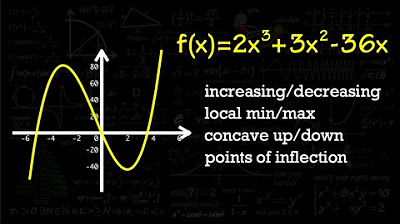
Graphs of f, f prime, and f double prime
TLDRIn this educational video, the instructor examines a graph of a function's derivative, 'F prime', to answer questions about the behavior of the original function 'F'. They determine intervals where 'F' is increasing by identifying where 'F prime' is positive. A relative maximum is found at x = -2, where 'F prime' changes from positive to negative. The graph's concavity is analyzed by observing 'F prime's' decreasing intervals, indicating 'F' is concave down from x = -3 to -1 and from 1 to 2. Points of inflection are identified at x = -1, 1, and 2, where 'F prime' changes direction. The instructor then synthesizes this information to sketch the graph of 'F', illustrating its key features.
Takeaways
- 📈 The discussion is centered around analyzing the graph of the derivative F'.
- 🔍 The speaker is identifying intervals where the function F is increasing by observing where F' is positive.
- ➕ F is increasing on the intervals (-3, -2) ∪ (0, 2) ∪ (2, 3) because F' is positive in these ranges.
- 📉 To find relative maxima, the speaker looks for points where F' changes from positive to negative.
- 🏔️ A relative maximum occurs at x = -2, where F' crosses the x-axis from above to below.
- ⬇️ For F to be concave down, F' should be decreasing or F'' should be negative.
- 📉 F is concave down on the intervals (-3, -1) ∪ (1, 2) as F' is decreasing in these ranges.
- ⚖️ Inflection points occur where F' changes direction, indicating a change in concavity.
- 🌀 Inflection points are identified at x = -1, 1, and 2 where F' changes from increasing to decreasing or vice versa.
- 🖊️ The speaker plans to graph F based on the information about F' and F'' from the analysis.
Q & A
What is the main topic of the video script?
-The main topic of the video script is analyzing a graph of a function's derivative, denoted as F', to determine the behavior of the original function F, including intervals of increase, relative maxima, concavity, and points of inflection.
What does it mean for a function to be increasing?
-A function is increasing on a certain interval if its derivative, F', is positive on that interval, indicating that the function's value is rising as the independent variable x increases.
How does the speaker determine the intervals where the function F is increasing?
-The speaker determines the intervals where F is increasing by identifying where F' is above the x-axis, which corresponds to F' being positive.
What is a relative maximum of a function?
-A relative maximum of a function occurs at a point where the derivative of the function changes from positive to negative, indicating the highest value of the function in a given neighborhood.
At what x-value does the speaker identify a relative maximum for the function F?
-The speaker identifies a relative maximum for the function F at x equals negative 2.
What does it mean for a function to be concave down?
-A function is concave down on a certain interval if its derivative, F', is decreasing on that interval, which can be visually identified by the slope of F' becoming less positive or more negative.
How does the speaker determine the intervals where the function F is concave down?
-The speaker determines the intervals where F is concave down by observing where F' is decreasing, which corresponds to the slope of F' becoming less positive or negative.
What is an inflection point of a function?
-An inflection point of a function is a point where the concavity of the function changes, meaning the function transitions from concave up to concave down or vice versa.
At what x-values does the speaker identify points of inflection for the function F?
-The speaker identifies points of inflection for the function F at x equals negative 1, 1, and 2.
How does the speaker use the information about F' to graph the original function F?
-The speaker uses the information about the intervals of increase, relative maxima, concavity, and points of inflection to sketch the graph of the original function F, ensuring that the graph reflects the behavior of F' as described.
What is the significance of the points where F' changes direction in the context of the function F?
-The points where F' changes direction are significant because they indicate points of inflection for the function F, which are crucial for understanding the overall shape and behavior of the function.
Outlines
📈 Analyzing Graphs of Functions and Their Derivatives
The speaker begins by introducing the task of analyzing a graph of a function 'F' and its derivative 'F prime' to answer questions about the behavior of the function. They explain the concept of intervals and how to determine when a function is increasing by looking for where 'F prime' is positive. The speaker identifies intervals where 'F' is increasing and provides a justification based on the graph's annotations. They also discuss how to find relative maximums by observing where 'F prime' changes from positive to negative, identifying a specific point at x equals negative 2.
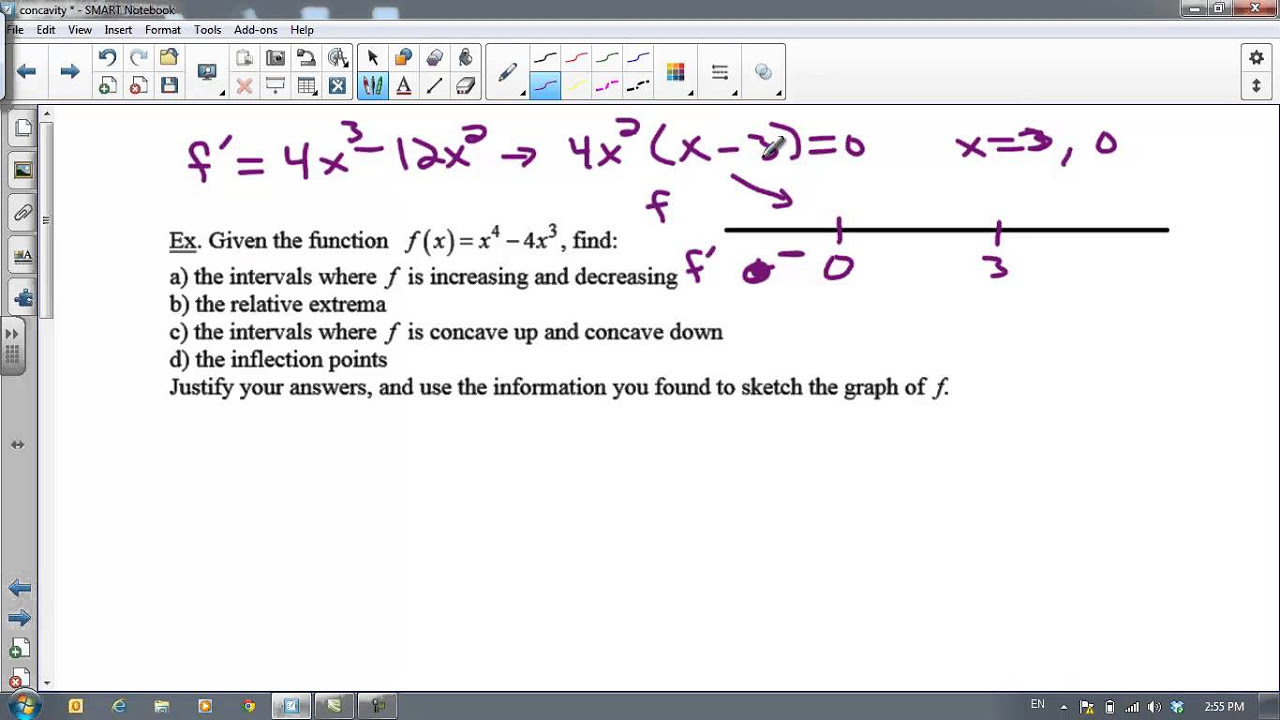
📉 Determining Concavity and Inflection Points
Continuing the analysis, the speaker explains how to determine when the graph of 'f' is concave down by looking for intervals where 'F prime' is decreasing. They identify two intervals where this occurs and then move on to discuss inflection points. The speaker uses the definition of an inflection point as a place where 'F prime' changes direction, identifying three such points at x equals negative 1, 1, and 2. They provide a detailed explanation of how 'F prime' changes from increasing to decreasing and vice versa at these points, indicating changes in the concavity of the graph.
📚 Constructing the Graph of Function F Based on Derived Information
The speaker concludes by using the information derived from the analysis of 'F prime' to construct a graph of the original function 'F'. They note the function's behavior at specific points, such as a relative maximum at x equals negative 2 and concave down intervals from negative 3 to negative 1 and from 1 to 2. The speaker also highlights the points of inflection at x equals negative 1, 1, and 2, where the concavity of the graph changes. They combine all the gathered information to sketch a graph that represents the function's behavior, including its increasing and decreasing intervals, concavity, and points of inflection.
Mindmap
Keywords
💡Graph
💡F' (F prime)
💡Interval
💡Increasing Function
💡Relative Maximum
💡Concave Down
💡Inflection Point
💡F'' (F double prime)
💡Critical Point
💡Y-Value
Highlights
Introduction to analyzing a graph of F' (the derivative of F) to answer questions about the behavior of F'' (the second derivative of F).
Identifying intervals where the graph of F is increasing by finding where F' is positive.
Determining the intervals [-3, -2), [0, 2), and (2, 3] as times when F is increasing based on F' being above the x-axis.
Excluding the point 2 from the interval for F increasing, as F' needs to be strictly positive.
Finding a relative maximum for F at x = -2 where F' goes from positive to negative.
Identifying intervals of concavity by looking for where F' is decreasing.
Determining the intervals [-3, -1] and [1, 2] as concave down based on F' decreasing.
Identifying points of inflection at x = -1, 1, and 2 where F' changes direction.
Using the definition of inflection points based on changes in the direction of F' rather than the sign of F''.
Graphing F based on the derived intervals of increase, concavity, and points of inflection.
Noting F(-3) = 0 as a starting point for graphing F.
Describing the concavity and monotonicity changes from -3 to -2, -2 to -1, and beyond -1 up to 2 based on the analysis of F'.
Highlighting the relative maximum at x = -2 and the concavity changes at x = -1, 1, and 2 on the graph of F.
The importance of correctly identifying intervals and points for increasing/decreasing and concave up/down behavior in function analysis.
The practical application of these findings in graphing the function F and understanding its behavior.
Transcripts


5.0 / 5 (0 votes)
Thanks for rating: