AP Calc - Graphing f from f'
TLDRThis video script provides a step-by-step guide on how to graph an original function from its derivative. The presenter uses a creative approach by assigning areas to different sections of the derivative graph to help visualize the original function's behavior. They start by identifying points where the derivative crosses zero, which correspond to local maxima and minima, then use these points to sketch the original function's shape. The script also covers how to determine concavity by analyzing the sign of the second derivative, indicating whether the function is concave up or down at different intervals. The presenter encourages viewers to practice by pausing the video and attempting to graph a function themselves, making this an interactive learning experience.
Takeaways
- 📈 The video is a tutorial on how to graph the original function from its derivative function, which is useful for various calculus problems.
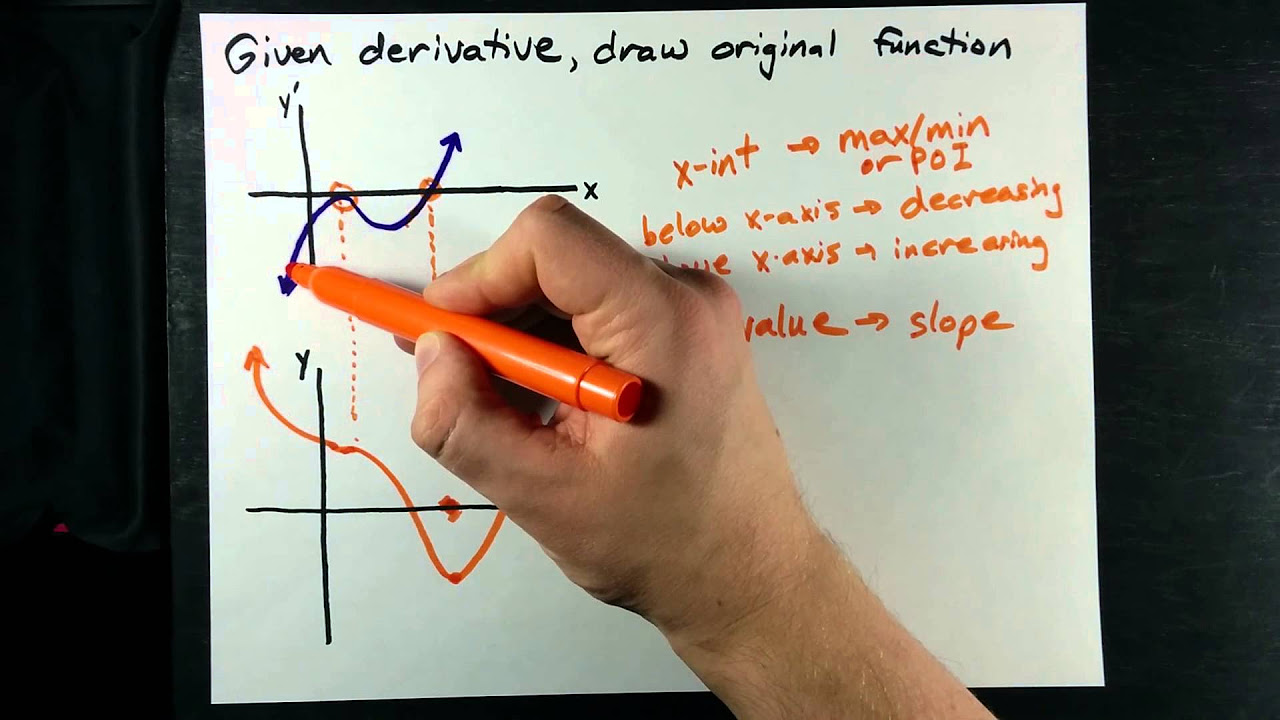
- 📚 The presenter starts by sketching an original graph with areas represented by numbers to indicate the function's values.
- 📌 The derivative graph is used to identify maximum and minimum points of the original function, where the derivative equals zero.
- 🔍 Positive and negative slopes on the derivative graph indicate where the original function increases and decreases, respectively.
- 📊 The presenter uses the concept of 'area' to estimate the values of the original function at certain points based on the derivative graph.
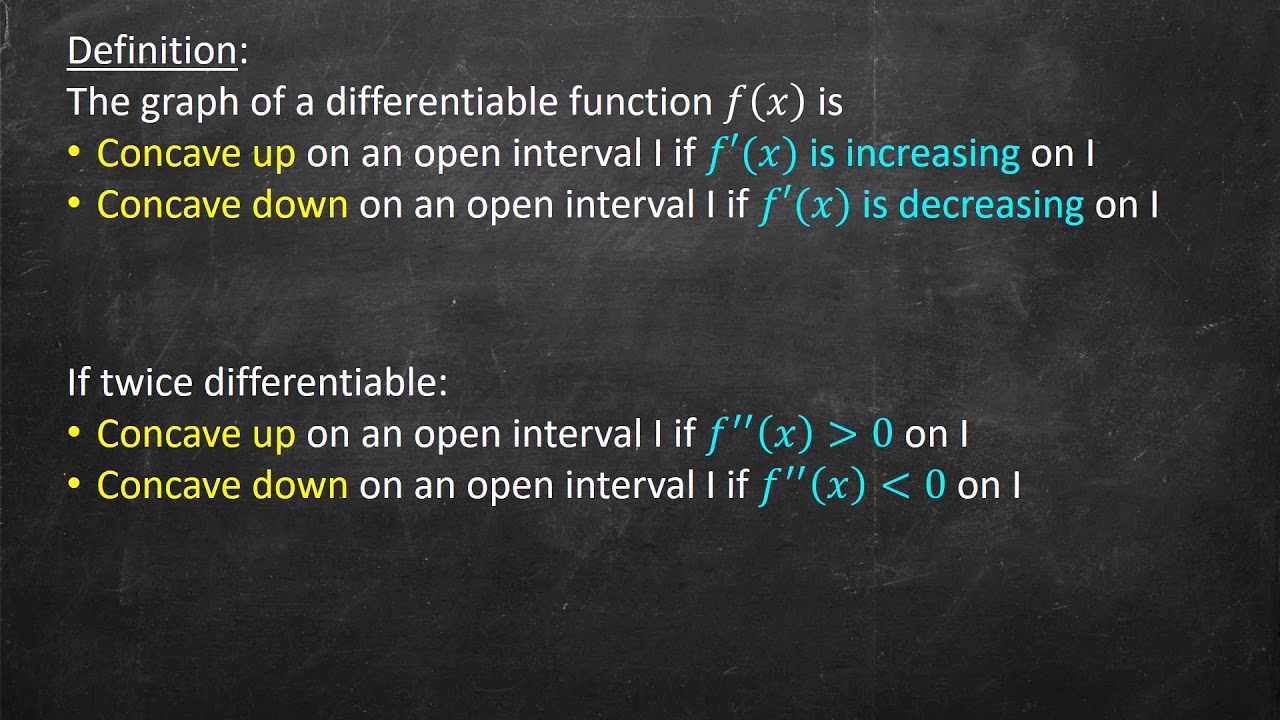
- 📉 The presenter explains that the second derivative can be used to determine concavity, with positive slopes indicating concave up and negative slopes indicating concave down.
- 🔢 The process involves calculating areas under the derivative graph to estimate the original function's values at specific points.
- 📐 The presenter demonstrates how to find points of inflection by analyzing changes in concavity from the derivative graph.
- 📝 The tutorial includes an exercise for viewers to practice graphing an original function from its derivative, encouraging them to pause the video and try it themselves.
- 🎓 The script emphasizes the importance of understanding the relationship between the derivative and the original function for solving calculus problems.
Q & A
What is the main topic of the video script?
-The main topic of the video script is how to graph the original function from a derivative function, which is helpful for solving various calculus problems.
What is the significance of the derivative hitting zero in the derivative graph?
-The points where the derivative hits zero are significant because they represent the maximum and minimum points (local max and mins) of the original function.
How does the speaker use areas to represent the original function from the derivative graph?
-The speaker uses areas to represent the original function by assigning arbitrary area figures to the derivative graph, which helps in visualizing the ups and downs of the original function.
What does the speaker mean by 'positive slope' and 'negative slope' in the context of the derivative graph?
-In the context of the derivative graph, 'positive slope' indicates that the original function is increasing, and 'negative slope' indicates that the original function is decreasing.
How does the speaker determine the local maximum and minimum points of the original function?
-The speaker determines the local maximum and minimum points by looking at the changes in the slope of the derivative graph, such as from positive to negative or vice versa.
What is the role of the second derivative in determining concavity?
-The second derivative, which is the derivative of the first derivative, helps in determining the concavity of the original function. A positive second derivative indicates concave up, while a negative second derivative indicates concave down.
How does the speaker use the second derivative to find points of inflection?
-The speaker uses the second derivative to find points of inflection by identifying where the concavity changes, which is when the second derivative changes sign.
What is the speaker's approach to graphing the original function without specific shapes like circles and triangles?
-The speaker's approach involves making up arbitrary areas for the derivative graph and then using these areas to infer the shape of the original function, considering the changes in slope and concavity.
How does the speaker suggest practicing graphing the original function from the derivative?
-The speaker suggests practicing by pausing the video and attempting to graph the original function from the derivative graph provided, using the methods discussed in the script.
What is the importance of understanding the relationship between the derivative graph and the original function?
-Understanding the relationship between the derivative graph and the original function is important for solving calculus problems that involve finding maxima, minima, and points of inflection, as well as for visualizing the behavior of the function.
Outlines
📈 Deriving Original Functions from Derivative Graphs
This paragraph explains the process of reconstructing the original function from its derivative graph. The speaker uses the concept of areas under the curve to illustrate how to find local maxima and minima, which correspond to points where the derivative is zero. The method involves identifying positive and negative slopes on the derivative graph to infer the behavior of the original function. The speaker also discusses how to determine concavity changes by analyzing the second derivative, which indicates whether the graph is concave up or down. The summary includes an example with made-up area figures to demonstrate the process of finding the original graph's features from its derivative.
📚 Practical Application: Graphing Functions from Derivatives
In this paragraph, the speaker provides a practical example of how to graph an original function from its derivative. They start by identifying zeros on the derivative graph, which correspond to potential maxima or minima on the original graph. The speaker then uses these points to sketch the original function, taking into account the slopes (positive or negative) to determine the shape of the graph. The paragraph also covers how to find points of inflection by looking at changes in concavity, which are inferred from the second derivative. The speaker guides through a step-by-step process, encouraging viewers to pause the video and try the exercise themselves, and ends with a brief mention of calculating areas for further analysis.
Mindmap
Keywords
💡Graph
💡Derivative Function
💡Original Function
💡Max and Min
💡Slope
💡Concavity
💡Second Derivative
💡Inflection Point
💡Area Under the Curve
💡Critical Points
💡Visual Reconstruction
Highlights
Introduction to graphing the original function from a derivative function.
Utility of the method for various calculus problems, including concavity and inflection points.
Starting with a derivative graph to identify maximum and minimum points.
Using the concept of positive and negative slopes to determine the direction of the original function.
Calculating the area under the derivative graph to find the original function's values.
Identifying the local maximum and minimum points from the derivative graph.
Explaining the process of finding the concavity of the original graph using the derivative graph.
Using the second derivative to determine the concavity of the original function.
Describing the concavity changes and how they relate to the original function's shape.
Demonstrating the process with an example, including made-up area figures.
Calculating the original function's values at specific points using the derivative graph.
Graphical representation of the original function based on the derivative graph's information.
Highlighting the importance of concavity in understanding the shape of the original graph.
Providing a step-by-step guide to graph the original function from the derivative.
Encouraging viewers to try the method themselves with a provided example.
Summarizing the process and encouraging practice for better understanding.
Inviting viewers to pause the video and try graphing the original function themselves.
Providing a final example with calculations to solidify the understanding of the method.
Transcripts
Browse More Related Video
Concavity introduction | Using derivatives to analyze functions | AP Calculus AB | Khan Academy
Concavity and the 2nd Derivative Test
Draw the Function given Graph of Derivative

Increasing/decreasing functions [IB Maths AI SL/HL]
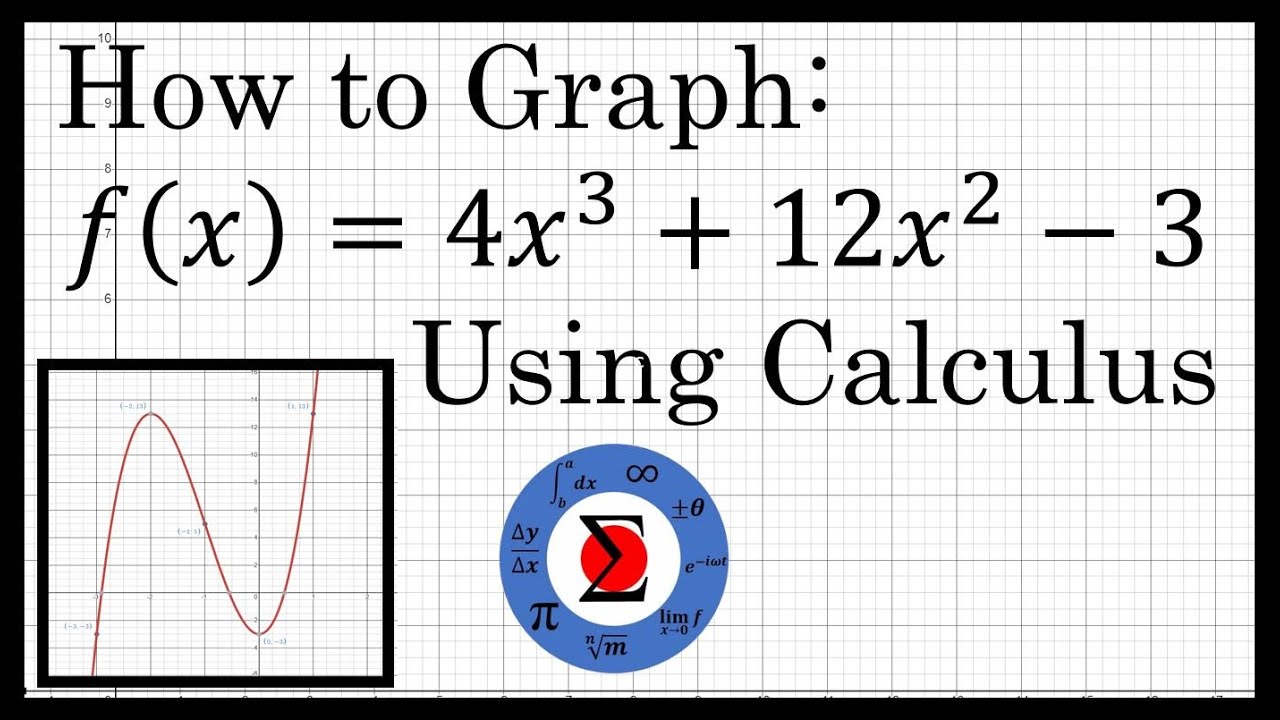
Graphing a Polynomial Equation :: Curve Sketching Using Calculus
Graphs of f, f prime, and f double prime
5.0 / 5 (0 votes)
Thanks for rating: