Linear Regression and Correlation - Introduction
TLDRThis video script introduces the fundamental concepts of linear regression, explaining the process of identifying a linear relationship between two variables, X and Y, using data pairs. It discusses the creation of a scatter plot to visualize potential relationships and the derivation of the line of least squares, which best fits the data on average. The script also covers the coefficient of correlation, denoted as 'R', which measures the quality of the linear relationship, ranging from -1 (perfect negative relationship) to 1 (perfect positive relationship), with 0 indicating no linear relationship. The explanation sets the stage for further exploration into calculating the line of least squares and the coefficient of correlation in subsequent content.
Takeaways
- 📊 Linear Regression is a statistical method used to determine the relationship between two variables, X and Y, and whether there is a linear relationship between them.
- 🔍 Data pairs (X, Y) are plotted on an XY plane, forming a scatter plot or scatter diagram, which visually represents the potential linear relationship.
- 🤔 The existence of a linear relationship is assessed by observing how the points in the scatter plot are distributed and if they can be approximated by a straight line.
- 📈 The 'line of least squares' is the unique straight line that best fits the data points in the scatter plot, minimizing the sum of the squares of the vertical distances from the points to the line.
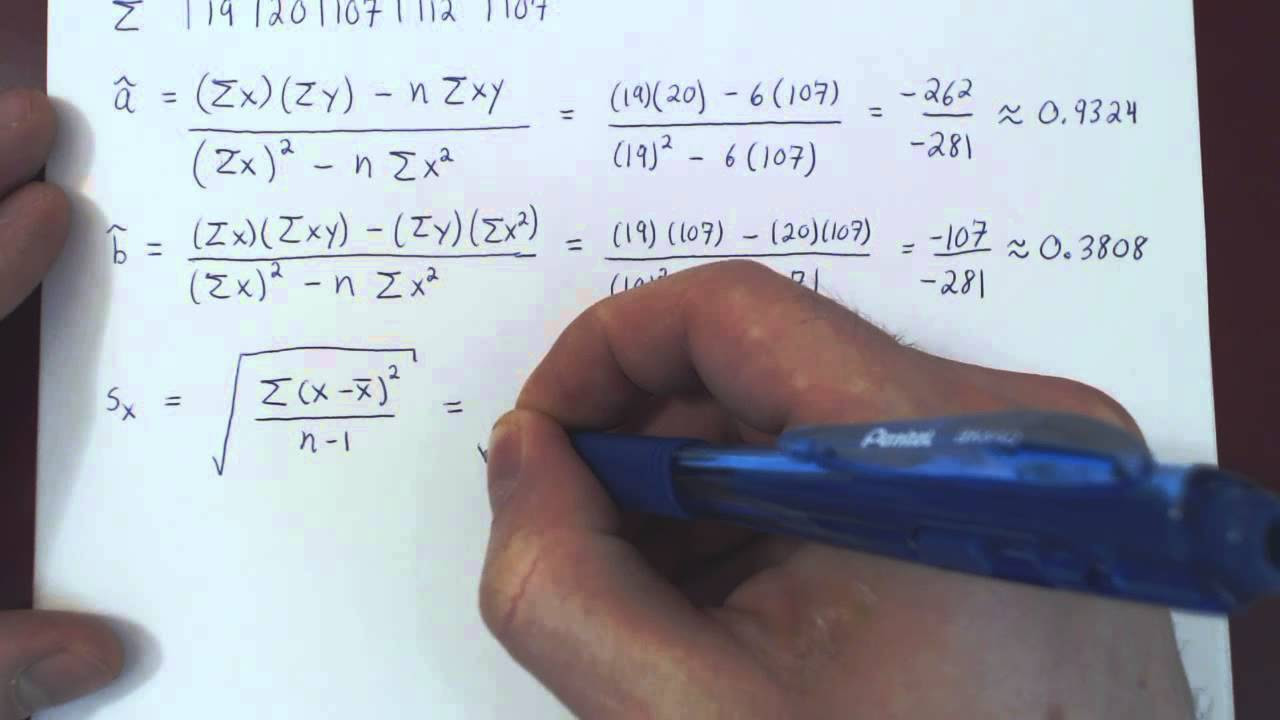
- 💭 The equation of the line of least squares is typically written as \( y = \hat{a}X + \hat{b} \), where \( \hat{a} \) is the slope and \( \hat{b} \) is the y-intercept.
- 📍 The slope \( \hat{a} \) and y-intercept \( \hat{b} \) of the line are determined through statistical calculations and are used to make predictions based on observed X values.
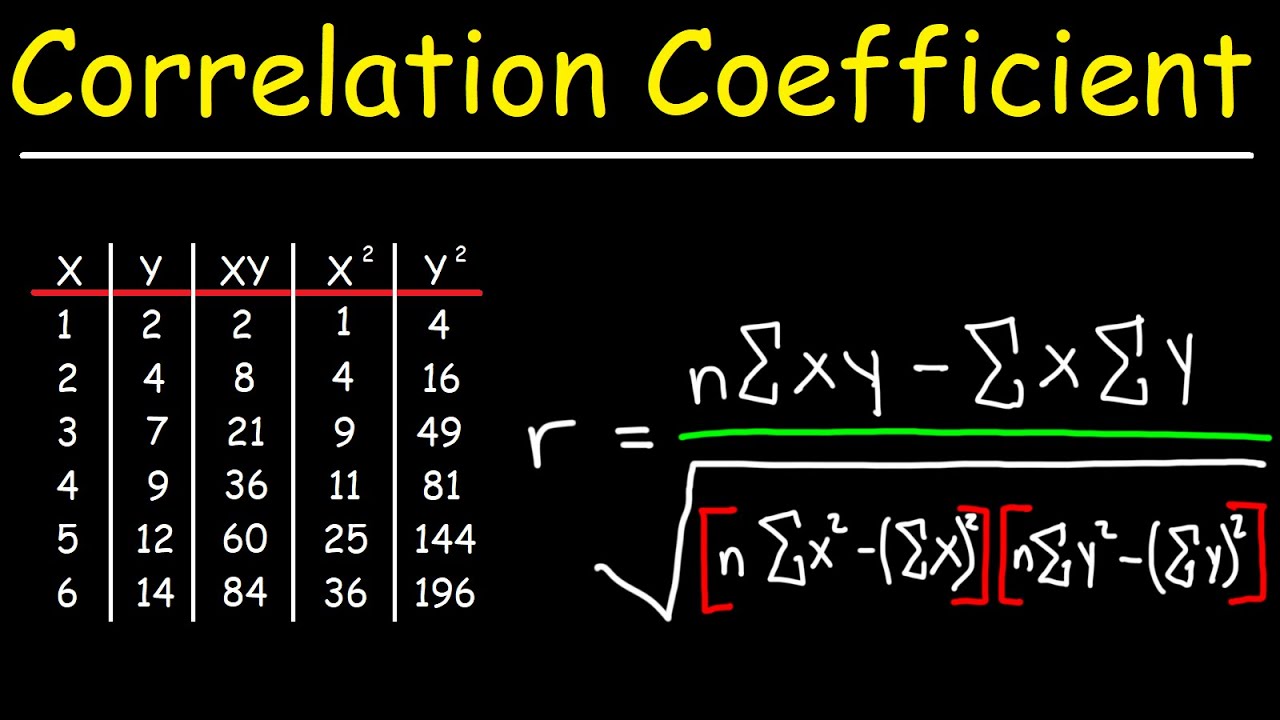
- ⚖️ The quality of the linear relationship and the accuracy of predictions are measured by the coefficient of correlation, denoted as 'R'.
- 🔢 The value of 'R' ranges from -1 to 1, with -1 indicating a perfect negative linear relationship, 1 indicating a perfect positive linear relationship, and 0 indicating no linear relationship.
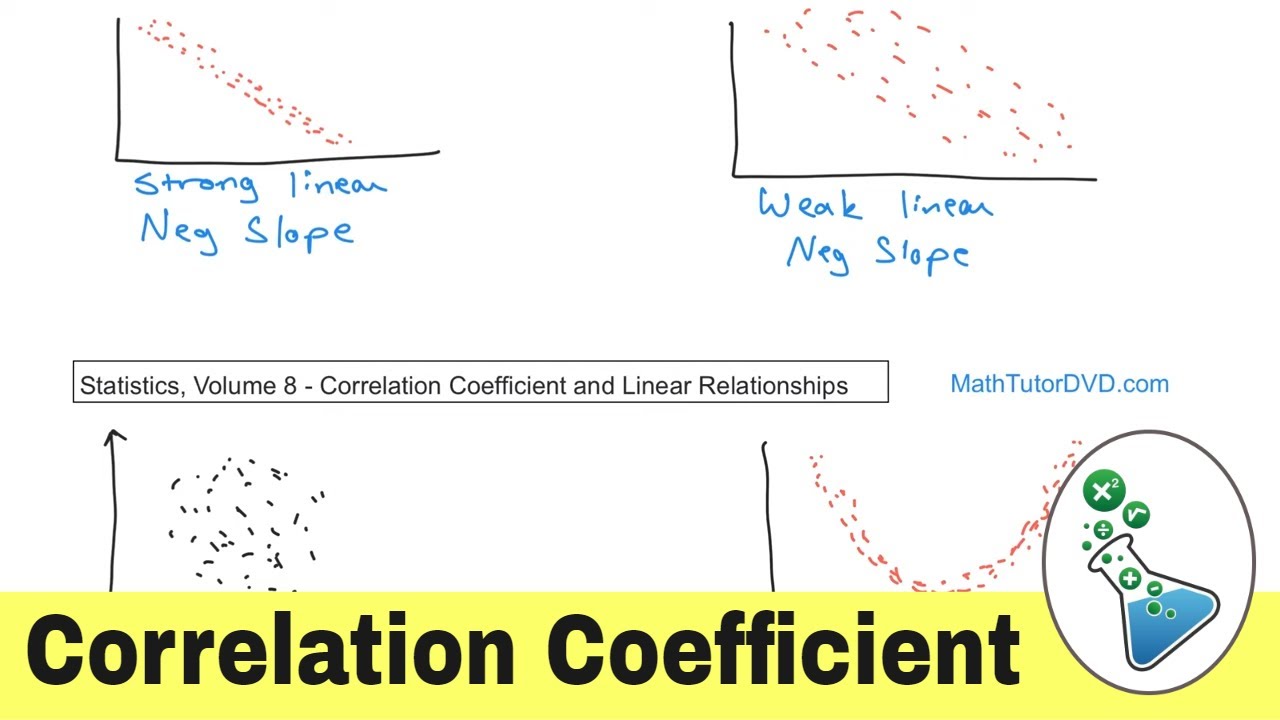
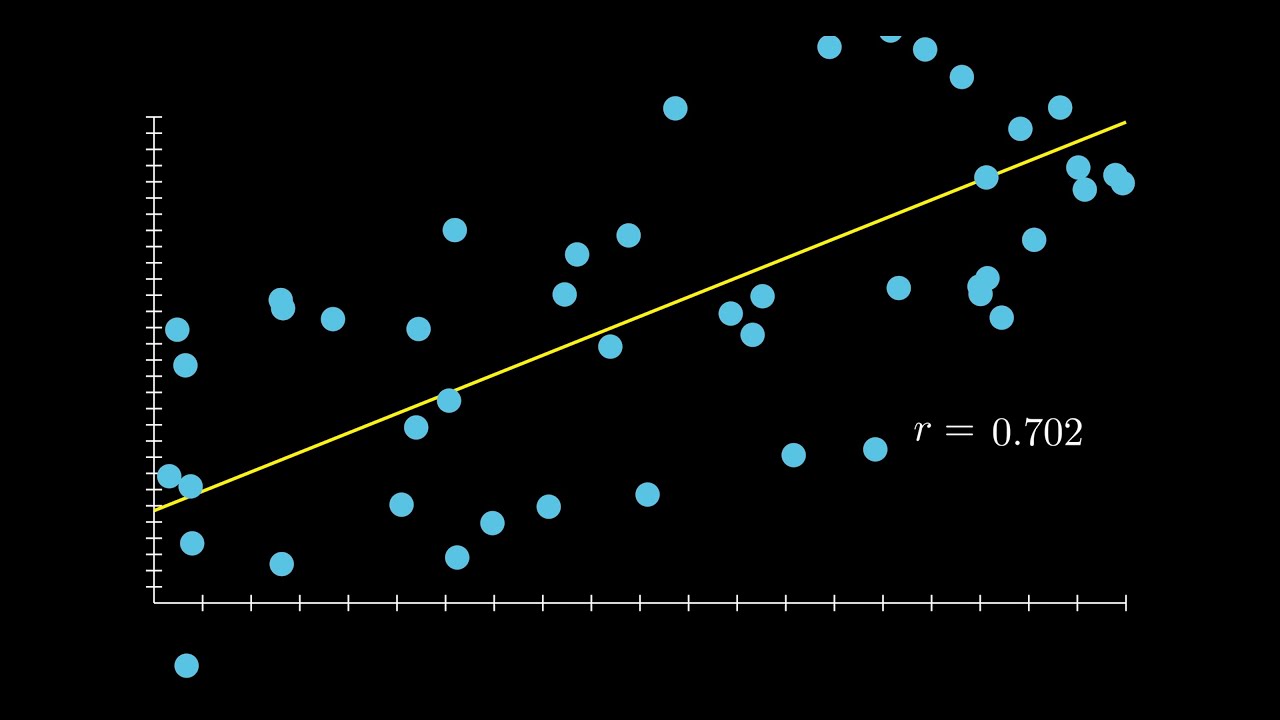
- 📉 A positive 'R' close to 1 suggests a strong positive linear relationship, while a negative 'R' close to -1 suggests a strong negative linear relationship.
- 🔎 When 'R' is close to 0, it indicates a weak linear relationship, and the line of least squares provides a poor approximation for predicting Y values based on X.
- 📚 The actual computation of the line of least squares and the coefficient of correlation will be covered in a subsequent video, with practical examples and calculations.
Q & A
What is the basic concept of linear regression?
-Linear regression is a statistical method used to model the linear relationship between two variables, where one variable (X) is used to predict the value of another variable (Y). It involves finding a straight line that best fits the data points on a scatter plot, minimizing the sum of the squares of the vertical distances from the points to the line.
What is a scatter plot and why is it used in linear regression?
-A scatter plot is a type of plot that displays the values of two variables for a set of data points. It is used in linear regression to visualize the relationship between the variables. Points on the scatter plot represent individual data pairs, and the distribution of these points can indicate whether a linear relationship exists between the variables.
What are the steps involved in creating a scatter plot for linear regression analysis?
-To create a scatter plot, you first need to have pairs of data points for the two variables (X and Y). Then, plot each pair on a Cartesian plane with X values on the horizontal axis and Y values on the vertical axis. The resulting pattern of points can help you determine if there is a linear relationship between the variables.
What is the line of least squares and why is it significant in linear regression?
-The line of least squares is the unique straight line that best fits the data points on a scatter plot, minimizing the sum of the squares of the residuals (the differences between the observed values and the values predicted by the line). It is significant because it represents the best linear approximation to the data, providing a model for prediction and analysis of the relationship between the variables.
How is the equation of the line of least squares represented?
-The equation of the line of least squares is represented in the form y = a * x + b, where 'a' is the slope of the line and 'b' is the y-intercept. In the context of the script, these are denoted with hats as â and b̂ to indicate they are the estimated values derived from the data.
What is the purpose of the coefficient of correlation (R) in linear regression?
-The coefficient of correlation (R) measures the strength and direction of the linear relationship between the two variables. It ranges from -1 to 1, where values close to 1 or -1 indicate a strong linear relationship, 0 indicates no linear relationship, and values in between indicate varying degrees of linear association.
How do you interpret the value of the coefficient of correlation (R)?
-If R is close to 1, it indicates a strong positive linear relationship; if R is close to -1, it indicates a strong negative linear relationship. If R is close to 0, it suggests that there is little to no linear relationship between the variables. The closer the absolute value of R is to 1, the better the predictions the line of least squares will make.
What does a positive slope in the line of least squares indicate about the relationship between X and Y?
-A positive slope in the line of least squares indicates that as the value of X increases, the value of Y also tends to increase. This implies a direct or positive relationship between the two variables.
What does a negative slope in the line of least squares indicate about the relationship between X and Y?
-A negative slope in the line of least squares indicates that as the value of X increases, the value of Y tends to decrease. This implies an inverse or negative relationship between the two variables.
What is the significance of the y-intercept (b̂) in the equation of the line of least squares?
-The y-intercept (b̂) is the point where the line of least squares crosses the y-axis. It represents the estimated value of Y when X is zero, providing a reference point for the linear model.
How can you determine the quality of predictions made by the line of least squares?
-The quality of predictions made by the line of least squares can be determined by the coefficient of correlation (R) and the distribution of the data points around the line. A high absolute value of R and data points closely clustered around the line indicate good prediction quality, while a low absolute value of R and scattered points suggest poor prediction quality.
Outlines
📊 Introduction to Linear Regression
This paragraph introduces the concept of linear regression, explaining the setup where two variables, X and Y, are examined for a linear relationship. The process involves collecting pairs of these variables, plotting them on an XY plane to create a scatter diagram, and then determining if a linear relationship exists by visualizing the data points. The unique line of best fit, known as the least squares line, is described as the line that on average passes closest to all the points in the scatter plot. The equation of this line is typically represented as y = aX + B, where 'a' is the slope and 'B' is the y-intercept. However, in this context, 'a hat' and 'B hat' are used to denote the estimated values from the data.
🔍 Evaluating the Fit of the Least Squares Line
The second paragraph delves into the effectiveness of the least squares line in making predictions. It emphasizes the importance of the coefficient of correlation, denoted as 'R', in measuring the quality of the linear relationship between the variables. 'R' ranges between -1 and 1, where values close to 1 or -1 indicate a strong linear relationship, with the sign indicating the direction of the relationship (positive or negative slope). If 'R' is close to zero, it suggests a weak linear relationship. The paragraph also discusses how a perfect linear relationship ('R' equal to 1) would result in all data points lying exactly on the least squares line, while values of 'R' close to 1 indicate a very good positive linear relationship.
📉 Understanding the Coefficient of Correlation
The final paragraph focuses on interpreting the coefficient of correlation ('R') and its implications for the linear relationship between variables. It outlines three main scenarios based on the value of 'R': close to 1 for a strong positive relationship, close to -1 for a strong negative relationship, and close to 0 for a weak or non-existent linear relationship. The paragraph clarifies that regardless of the data, a least squares line can always be drawn, but its predictive power varies with the value of 'R'. The closer 'R' is to 1 or -1, the better the predictions will be, whereas 'R' close to 0 indicates poor predictive value. The discussion sets the stage for the next video, which will cover the computation of the least squares line and the coefficient of correlation using a concrete example.
Mindmap
Keywords
💡Linear Regression
💡Variables
💡Scatter Plot
💡Data Pairs
💡Line of Least Squares
💡Slope
💡Y-Intercept
💡Coefficient of Correlation
💡Positive Slope
💡Negative Slope
💡Prediction
Highlights
Introduction to the basic ideas of linear regression.
Explaining the setup of linear regression with two variables, X and Y.
Describing how pairs of variables are sampled and represented in the XY plane.
The concept of a scatter plot or scatter diagram to visualize data pairs.
The existence of a unique line, the line of least squares, that best fits the scatter plot.
The line of least squares is represented by a linear equation y = â*x + b̂.
The purpose of the line of least squares is to model a system of predictions.
The importance of the coefficient of correlation in measuring the quality of predictions.
The coefficient of correlation, denoted as R, ranges between -1 and 1.
Interpretation of R values: close to 1 indicates a strong positive linear relationship.
Interpretation of R values: close to -1 indicates a strong negative linear relationship.
Interpretation of R values: close to 0 indicates a weak linear relationship.
The relationship between the sign of R and the slope of the least squares line.
The impact of R's value on the quality of the linear approximation.
The necessity of calculating the line of least squares and the coefficient of correlation from actual data pairs.
The upcoming discussion on how to compute the line of least squares and the coefficient of correlation in the next video.
Transcripts

5.0 / 5 (0 votes)
Thanks for rating: