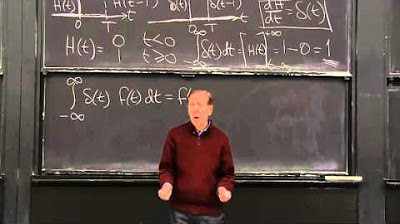
Big Picture of Calculus
TLDRIn this introductory calculus lecture by Gilbert Strang, the focus is on understanding the relationship between two functions, exemplified by distance and speed, and height and slope. Strang emphasizes the importance of seeing the big picture in calculus, beyond the complexity of textbooks. The video covers basic concepts such as differential and integral calculus, using examples like constant speed, growth spurts, and acceleration to illustrate how calculus can be applied to real-world scenarios. The power of calculus is highlighted in determining areas under curves and in finding formulas for functions based on their rates of change.
Takeaways
- 📚 Calculus is centered around the relationship between two functions, exemplified by distance and speed or height and slope.
- 🛣️ The concept of distance (function 1) and speed (function 2) is introduced using a car trip meter, where distance traveled is the input and the speed is the rate of change of distance.
- 📈 Understanding the 'big picture' of calculus is emphasized over getting lost in the details, highlighting the importance of visual representation of functions and their relationships.
- 🔄 Calculus can move in both directions: from function one to function two (differential calculus) and from function two to function one (integral calculus).
- 🏞️ The example of height and rate of change of height (growth) is used to illustrate how calculus can model real-world scenarios such as human growth spurts.
- 📊 The concept of slope representing the rate of change is explored, showing how it can be constant (as in a straight line) or changing (as in a curve).
- 🚀 The script uses the analogy of a car slowing down and then reversing to explain negative speeds and how calculus can represent changes in both directions.
- 📝 The use of algebraic notation (df/dt and dy/dx) is introduced to represent the rate of change between function 1 and function 2.
- 🌟 The power rule in calculus is briefly touched upon when discussing the relationship between the rate of change of a function and its form.
- 🎥 The video is part of a series on calculus highlights, aiming to provide a clear and accessible introduction to the subject.
- 💰 An example involving wealth and saving/spending illustrates how calculus can be applied to understand the rate of change in financial situations.
Q & A
What is the main focus of the video series on calculus presented by Gilbert Strang?
-The main focus of the video series is to highlight the key concepts of calculus in an accessible way, emphasizing the relationship between two functions and how they can be used to understand various real-world scenarios.
How does Professor Strang define calculus?
-Professor Strang defines calculus as being about the relationship between two functions, particularly how one function's rate of change is related to another function.
What are the two pairs of functions discussed in the video?
-The two pairs of functions discussed are: 1) distance traveled (function 1) and speed (function 2), and 2) height (function 1) and slope (function 2).
What is the significance of the function f(t) in the context of distance traveled?
-In the context of distance traveled, the function f(t) represents the distance as a function of time, where 't' is the input (time) and 'f' is the output (distance).
How does the concept of slope relate to the rate of change in calculus?
-The concept of slope in calculus is directly related to the rate of change. It represents how quickly a quantity is changing at any given point, such as how fast you are climbing (rate of change of height) or how fast you are traveling (rate of change of distance).
What is the notation used to represent the rate of change of function f with respect to time t?
-The notation used to represent the rate of change of function f with respect to time t is df/dt, which is pronounced 'dee eff dee tee'.
How does the video illustrate the concept of constant speed?
-The video illustrates the concept of constant speed by showing a straight line graph where the speed remains the same over time, resulting in a linear increase in distance.
What is the significance of the height and slope graph in the context of climbing a mountain?
-The height and slope graph in the context of climbing a mountain shows the height one has climbed (function 1) and the slope at each point (function 2), which indicates the steepness or incline of the climb at that particular location.
How does the video connect the concepts of differential and integral calculus?
-The video connects the concepts by showing that differential calculus is used to find the rate of change (function 2) given a function (function 1), while integral calculus is used to recover the original function (function 1) from its rate of change (function 2).
What is the example given in the video to illustrate the concept of a growth spurt in the context of a person's height?
-The video uses the example of a person's height (function 1) and its rate of change (function 2) to illustrate a growth spurt. It shows a graph where the rate of growth (slope) increases sharply during the growth spurt period and then levels off.
How does the video demonstrate the application of calculus to the concept of wealth accumulation?
-The video demonstrates the application of calculus to wealth accumulation by presenting wealth (function 1) and its rate of change (function 2), where a positive rate of change (s) indicates saving and a negative rate of change indicates spending.
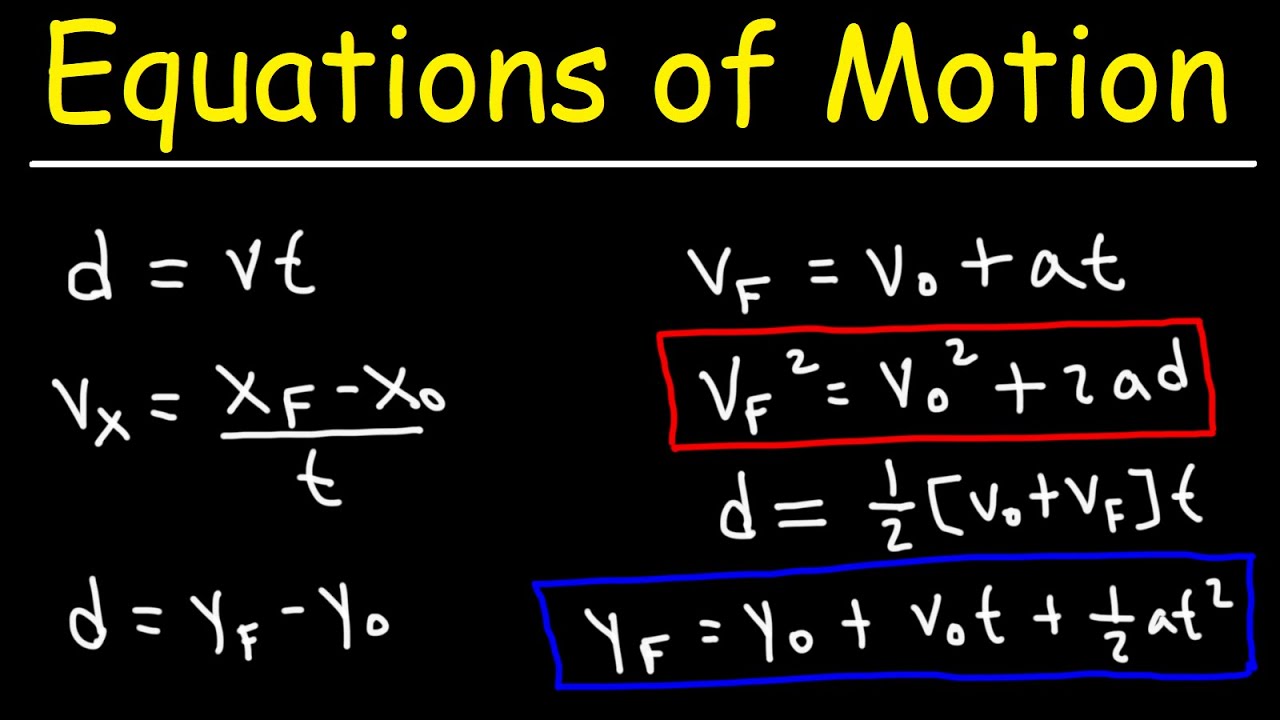
What is the formula derived for distance in the context of constant acceleration?
-In the context of constant acceleration, the formula derived for distance (function 1) is 1/2 * a * t^2, where 'a' is the acceleration and 't' is the time.
Outlines
📘 Introduction to Calculus
Professor Gilbert Strang introduces the series of videos on calculus, aiming to provide a clear understanding of the subject which is often found difficult to navigate through textbooks. He emphasizes the importance of seeing the 'big picture' and presents the concept of calculus as the relationship between two functions, using distance and speed, and height and slope as examples. The professor introduces algebraic notations for these functions and explains the connection between them using derivatives, represented by 'df/dt' and 'dy/dx'.
🏃♂️ Constant Speed and Slope
The video segment focuses on the scenario of constant speed and slope, using a graphical representation to illustrate the concept. The professor explains how constant speed results in a straight line graph for distance over time, and how the slope of this line represents the speed. He further explores the concept of slope in relation to distance and time, using the delta notation to indicate changes in these quantities.
🚗 Changing Speed and Distance
This paragraph delves into the concept of changing speed and its effect on the graph of distance over time. The professor sketches a graph demonstrating a car slowing down, explaining how the slope of the graph (representing speed) decreases to zero, indicating the car's stop at a red light. He introduces the idea of differential and integral calculus, describing how calculus can be used to find one function given the other.
🎬 Application of Calculus in Real Life
The professor discusses the practical applications of calculus, using the example of a car's trip meter from the movie 'Ferris Bueller's Day Off'. He humorously points out how understanding calculus could have helped the character in the movie. The segment aims to show the relevance of calculus in everyday scenarios and its importance in understanding changes and relationships between different quantities.
📈 Growth and Rate of Change
The segment focuses on the relationship between a person's height (function one) and the rate of change of height (function two). The professor illustrates how growth spurts in humans can be represented as a steep increase in the rate of change graph. He also introduces another pair of functions related to wealth and saving or spending, emphasizing the importance of understanding the rate of change in various contexts.
🚀 Acceleration and Distance
The professor discusses the concept of acceleration and its effect on distance. He uses the example of an object in free fall (like dropping something from the Tower of Pisa) to explain how the speed of the object increases over time due to gravity. The segment covers the calculation of distance when speed increases at a constant rate, leading to the discovery of a parabolic function relating distance and time.
🎓 Conclusion and Acknowledgments
In the concluding segment, the professor summarizes the main points covered in the video, highlighting the process of moving from one function to another using calculus. He reiterates the importance of understanding calculus as it reveals the relationship between functions and the area under a curve. The video ends with acknowledgments to MIT OpenCourseWare, Gilbert Strang, and the Lord Foundation for their contributions and support.
Mindmap
Keywords
💡Calculus
💡Functions
💡Derivative
💡Integral
💡Rate of Change
💡Slope
💡Constant Speed
💡Growth Spurt
💡Acceleration
💡Parabolic Curve
💡Area Under the Curve
Highlights
Calculus is about the relation between two functions, such as distance and speed.
The big picture in calculus is often overlooked in favor of details and problems.
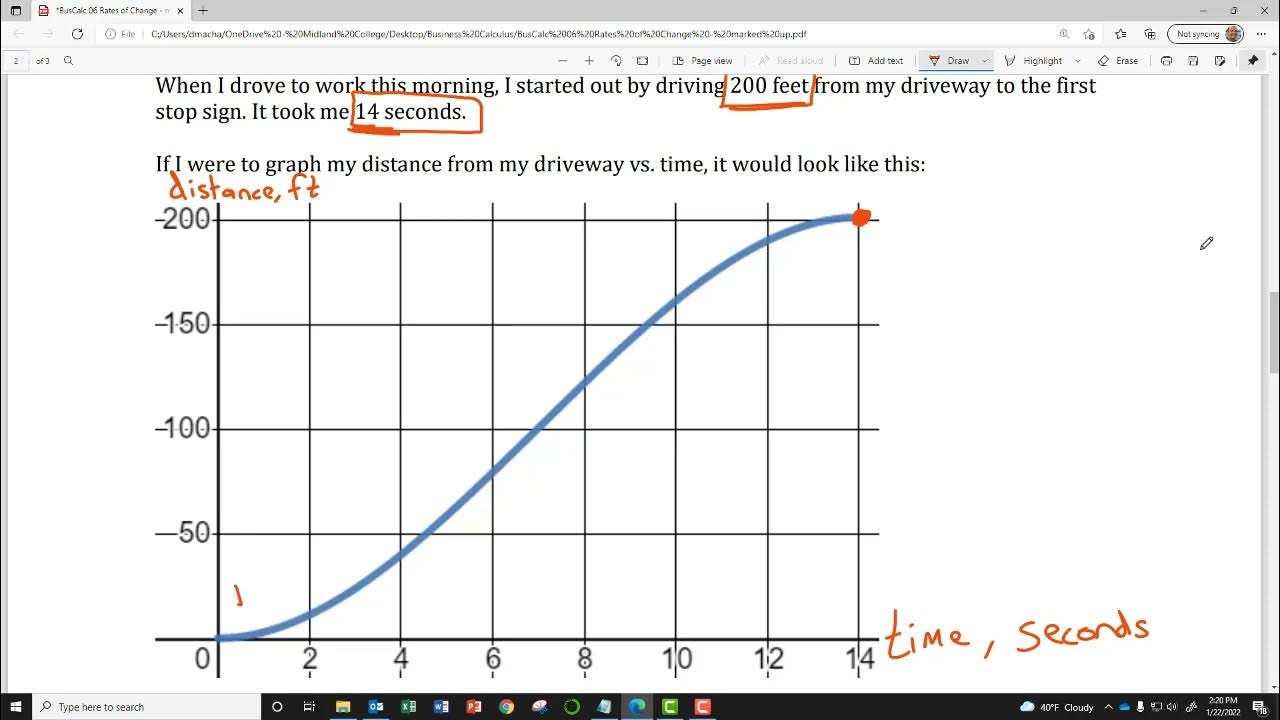
Function 1 could represent distance traveled, as seen on a trip meter in a car.
Function 2 could represent speed, or how quickly one is traveling.
Another pair of functions could be height as function 1 and slope as function 2.
Algebraic notation for function 1 includes f(t) for distance and y(x) for height.
The rate of change, or slope, is represented by derivatives such as df/dt or dy/dx.
In the case of constant speed, the distance traveled forms a straight line on the graph.
The slope of a line in a distance vs. time graph indicates the speed of travel.
If speed is constant, the distance traveled is directly proportional to time.
Changing speed can be represented by a curve on the graph, showing variations in the rate of distance traveled.
The rate of change of height over time can be used to understand growth patterns, such as human height.
The wealth and rate of saving or spending can be represented as a pair of functions similar to distance and speed.
The study of calculus involves moving between function one and function two, either from differential to integral calculus or vice versa.
In the case of constant acceleration, the distance traveled follows a parabolic curve.
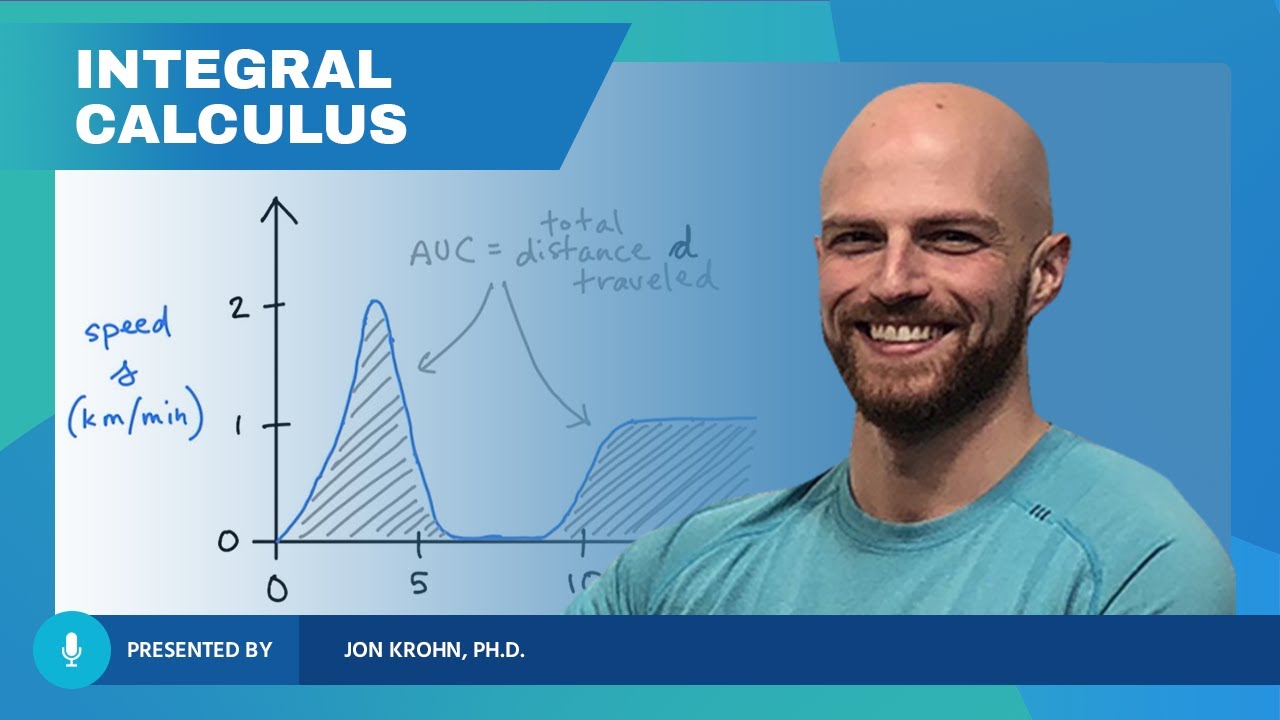
The area under the speed graph can be used to calculate the distance traveled, as seen in the triangle formed by constant acceleration.
The power rule in calculus is demonstrated by the relation between a function and its derivative, such as 1/2 at^2 and at.
Calculus provides a method to recover one function from another, such as finding the distance traveled from a record of speed.
The difference between a running total like distance and an instantaneous measure like speed is a key concept in understanding calculus.
Transcripts


5.0 / 5 (0 votes)
Thanks for rating: