Parameter vs Statistic
TLDRThe video script discusses the distinction between parameters and statistics in the context of studying statistics. It emphasizes the importance of understanding whether one is dealing with a population or a sample, as this affects the use of symbols and terminology. Parameters are numerical descriptions of population characteristics and are often denoted by Greek letters, while statistics describe samples and are associated with the letter 'S'. The video provides examples to illustrate the concept and encourages viewers to practice identifying whether given data points are parameters or statistics.
Takeaways
- 📊 Parameters are numerical descriptions of population characteristics, whereas statistics describe samples.
- 🔤 The terms 'parameter' and 'statistic' both start with 'P' and 'S' respectively, helping to remember their association with populations or samples.
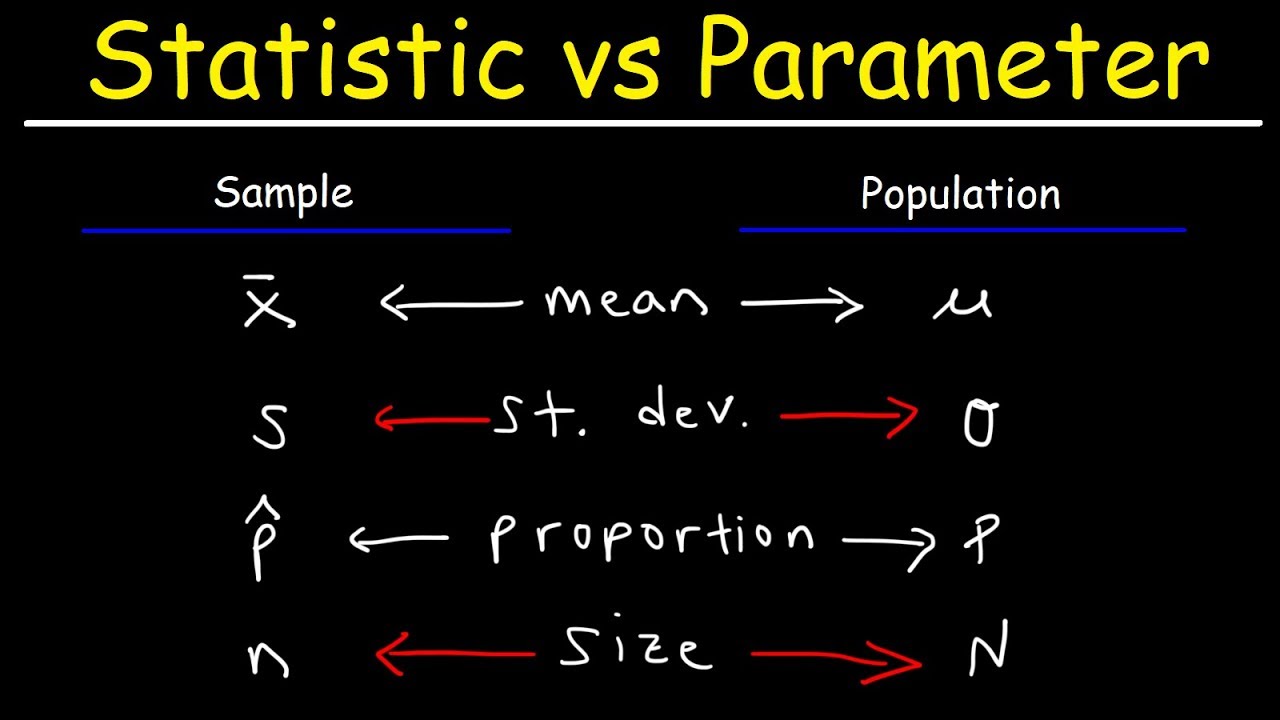
- 🌐 In statistics, Greek letters are commonly used to denote population parameters.
- 📝 It's beneficial to create a symbol list when studying statistics to keep track of which symbols correspond to parameters or statistics.
- 👥 An example of a population parameter is the average age of all people in the United States.
- 📝 An example of a statistic is the average age of people from a sample of three states.
- 🔍 Often, due to practicality, statistics are used to infer information about populations since studying entire populations can be challenging.
- 🏫 A realistic example of a sample statistic might be the average age calculated from a selected group of 1,000 adults living in the United States.
- 👨🎓 The average time spent on athletics per week by collegiate student-athletes surveyed across several hundred individuals is an example of a statistic.
- 🎓 The average SAT math score of an entire freshman class at a university is considered a parameter since it describes that specific population.
- 💡 Understanding the difference between a sample statistic and a population parameter is crucial in statistical analysis and interpretation.
Q & A
What is the main difference between a parameter and a statistic?
-A parameter is a numerical description of a population characteristic, while a statistic is a numerical description of a sample.
Why is it important to distinguish between a parameter and a statistic?
-It is important to distinguish between the two because they represent different aspects of data analysis: parameters refer to the entire population, whereas statistics refer to samples drawn from that population.
What is the role of the Greek alphabet in representing population parameters?
-The Greek alphabet is commonly used to symbolize population parameters in statistics, so when you see a Greek letter, it is often representing a parameter.
What is the example of a population parameter given in the script?
-The example of a population parameter is the average age of all people in the United States.
What is the example of a sample statistic given in the script?
-The example of a sample statistic is the average age of people from a sample of three states.
Why do we often deal with samples instead of entire populations in statistics?
-We often deal with samples because it is usually impractical or difficult to study the entire population, and samples can provide a more manageable and representative subset for analysis.
What is the key to identifying whether a piece of data is a sample statistic or a population parameter?
-The key is to look at whether the data is describing an entire population or just a sample. If it's the entire population, it's a parameter; if it's a subset, it's a statistic.
How does the script illustrate the concept of a sample statistic?
-The script illustrates a sample statistic with the example of the average time spent on athletics by several hundred collegiate student-athletes during their sports season.
How does the script illustrate the concept of a population parameter?
-The script illustrates a population parameter with the example of the average SAT math score of the freshman class at a specific university.
What is a common mistake students make when distinguishing between parameters and statistics?
-A common mistake is assuming that data from a single university or a limited group is a sample when it actually represents the population for that specific context.
How can one improve their understanding of statistical symbols and concepts?
-One can improve their understanding by creating a symbol list as they progress through their statistics course, noting which symbols correspond to parameters or statistics, and actively practicing by identifying parameters and statistics in given examples.
Outlines
📚 Understanding Parameters and Statistics
This paragraph introduces the key difference between parameters and statistics in the context of studying statistics. A parameter is defined as a numerical description of a population characteristic, relevant when discussing the entire population, and typically denoted by Greek letters. On the other hand, a statistic is the numerical description of a sample, with the emphasis on the letter 'S'. The speaker suggests creating a symbol list to help differentiate between parameters and statistics, as the multitude of symbols in statistics can be challenging. The paragraph also provides examples to illustrate the concepts: the average age of all people in the United States is a parameter, while the average age of people from a sample of three states is a statistic.
🔍 Identifying Parameters and Statistics in Real-Life Examples
The speaker continues the discussion by diving into real-life examples to distinguish between parameters and statistics. The first example involves a survey of several hundred collegiate student-athletes, where the average time spent on athletics is found to be 50 hours per week. This is identified as a sample statistic, as it pertains to a subset of the larger population of collegiate student-athletes. The second example is the average SAT math score of the freshman class at a university, which is considered a parameter since it refers to the entire freshman class at that specific university. The speaker emphasizes the importance of recognizing whether the data pertains to a sample or an entire population to correctly identify a statistic or a parameter.
Mindmap
Keywords
💡parameter
💡statistic
💡population
💡sample
💡numerical description
💡Greek alphabet
💡symbol list
💡census
💡average
💡SAT math score
💡inference
Highlights
The distinction between a parameter and a statistic is crucial in the study of statistics.
Parameters are numerical descriptions of population characteristics.
Statistics are numerical descriptions of sample characteristics.
Greek letters are commonly used to represent population parameters.
The term 'parameter' starts with a 'P', emphasizing its association with the population.
The term 'statistic' also starts with an 'S', highlighting its connection to samples.
It is recommended to create a symbol list when studying statistics to keep track of different symbols for parameters and statistics.
The average age of all people in the United States is an example of a population parameter.
The average age of people from a sample of three states is an example of a sample statistic.
Statistics are often used instead of studying entire populations due to practicality and feasibility.
The U.S. Census attempts to gather information on the entire population but may still miss some individuals.
A more realistic example of a sample statistic is the average age of 1,000 selected adults in the United States.
The video provides examples to help viewers determine whether a number describes a population parameter or a sample statistic.
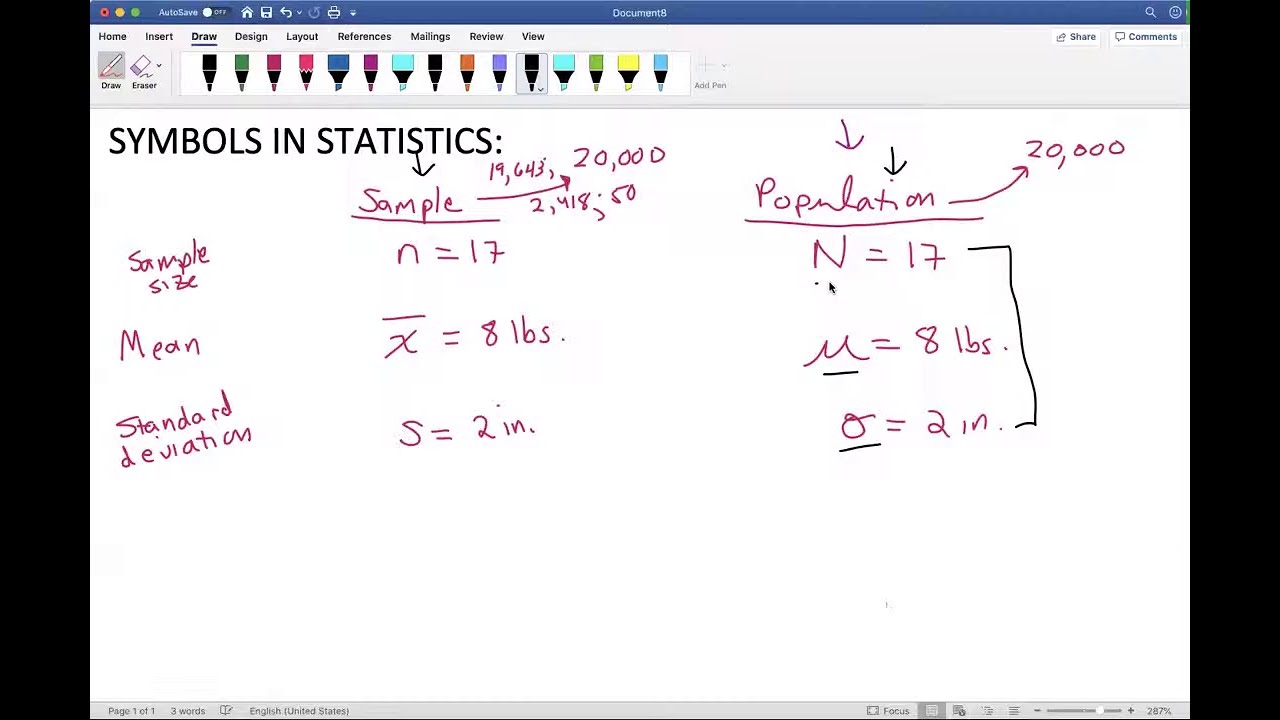
The average time of 50 hours per week spent on athletics by collegiate student-athletes is a sample statistic.
The average SAT math score of 514 for a freshman class at a university is a population parameter for that specific university.
It is important to recognize that a parameter for one university is not comparable to another, making it a specific population.
The video aims to help viewers identify the difference between a sample statistic and a population parameter.
Transcripts
Browse More Related Video

Symbols commonly used in statistics
DIFFERENCE BETWEEN PARAMETER AND STATISTIC | STATISTICS AND PROBABILITY | TAGLISH
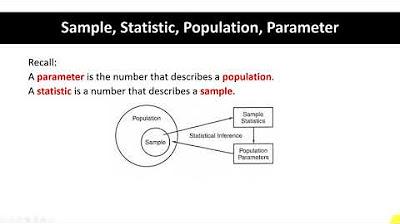
Sample, Statistic, Population, Parameter Part 1
Symbols in statistics. Sample or Population?
Populations, Samples, Parameters, and Statistics
Statistic vs Parameter & Population vs Sample
5.0 / 5 (0 votes)
Thanks for rating: