Introduction to Basic Statistical Notation: Sigma and Summation
TLDRThe video script introduces fundamental statistical notation and symbols, focusing on the Greek uppercase letter Sigma, which represents summation. It explains how to calculate the sum of a variable's scores (ΣX) and the sum of squared scores (ΣX^2), using a spreadsheet for demonstration. The script emphasizes the importance of understanding these concepts for further statistical calculations in the course, highlighting their utility in various statistical analyses.
Takeaways
- 📝 The Greek uppercase letter Sigma (Σ) represents summation or the act of adding together a series of values.
- 🔢 In statistical notation, ΣX denotes the sum of all the values for the variable X.
- 📈 To calculate ΣX, you simply add up all the scores of variable X, as demonstrated with a small dataset leading to a sum of 426.
- 📊 For more complex calculations, you can use Σ(X^2) to represent the sum of the squared values of variable X.
- 🤓 Squaring each value of X and then summing them up results in a different value than summing X and then squaring the result (ΣX^2 vs. (ΣX)^2).
- 🧮 The process of squaring each value of X and summing them is shown through creating a new column in a spreadsheet and performing the operation in Excel.
- 🔍 The sum of the squared X's (Σ(X^2)) is calculated to be 6,632.4 in the example provided.
- 📐 The sum of X squared (ΣX^2) is different from the square of the sum of X ( (ΣX)^2 ), and understanding this distinction is crucial for accurate statistical analysis.
- 🎓 These statistical notations and operations are fundamental components in basic statistics classes and are essential for further calculations in the course.
- 💡 A firm grasp of these basic statistical notations and operations is necessary for more advanced statistical calculations and analysis in the future modules.
- 🙏 The video aims to educate viewers on basic statistical notation and emphasizes the importance of understanding these concepts for future learning.
Q & A
What does the Greek uppercase letter Sigma represent in statistics?
-The Greek uppercase letter Sigma represents the operation of summation or adding up values in statistics.
How is the symbol ΣX used in the context of the script?
-ΣX is used to denote the sum of all the scores for the variable X.
What is the result of adding up all the values for variable X in the provided data set?
-The sum of all the values for variable X in the provided data set is 426.
What does the notation Σ(X^2) represent?
-Σ(X^2) represents the sum of the squared values of the variable X.
How can you calculate the sum of the squared X's using a spreadsheet?
-You can calculate the sum of the squared X's by creating a column for the squared values of X, squaring each value, and then summing these squared values.
What is the result of the sum of the squared X's in the example?
-The result of the sum of the squared X's in the example is 6,632.4.
How is the sum of X squared different from the sum of the squared X's?
-The sum of X squared refers to squaring the total sum (ΣX) before taking the sum, whereas the sum of the squared X's involves squaring each individual value of X and then summing those squared values.
What is the value of ΣX in the script's example?
-The value of ΣX in the script's example is 426.
How can you calculate the sum of X squared in the example?
-To calculate the sum of X squared, you would square the sum of X (which is 426) to get 183,647.
Why are these statistical notations important for understanding and calculations in a basic statistics class?
-These notations are important because they are common components in various calculations and analyses performed in basic statistics classes, providing a foundation for understanding and performing more complex statistical procedures.
Outlines
📊 Introduction to Statistical Notation and Symbols
This paragraph introduces the viewer to basic statistical notation and symbols, focusing on the Greek uppercase letter Sigma (Σ) which represents summation or the addition of values. It explains that ΣX signifies the addition of all scores for the variable X, using a practical example of adding up values in a dataset to calculate the sum of X, denoted as ΣX. The explanation is supported by a demonstration of how to perform this operation in a spreadsheet, resulting in a sum of 426 for the given data set.
Mindmap
Keywords
💡Statistical Notation
💡Summation
💡Order of Operations
💡Spreadsheet
💡Squaring Values
💡Sum of X Squared
💡Descriptive Statistics
💡Variance
💡Data Analysis
💡Statistical Inferences
💡Hand Calculations
Highlights
The video describes basic statistical notation symbols.
The Greek uppercase letter Sigma represents summation or adding.
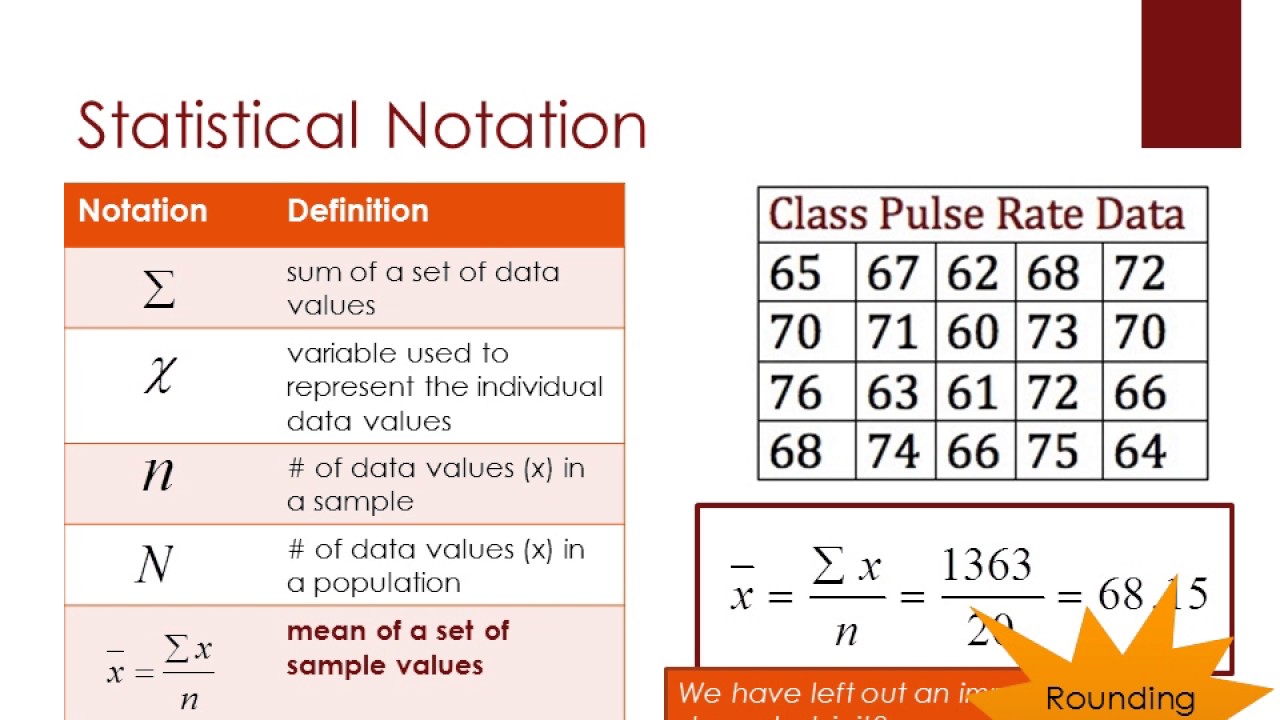
Sigma X indicates to add up all the scores for the variable X.
The process of summing values is demonstrated with a data set.
The sum of X scores is calculated to be 426 in the example.
The video explains how to calculate the sum of the squared X's.
A column for squared values of X is created in a spreadsheet.
The sum of squared X's is calculated to be 6,632.4 in the example.
The difference between Sigma X and the sum of X squared is clarified.
The sum of X squared is obtained by squaring the total sum of X.
The number 426 is squared to get the sum of X squared, resulting in 181,474,576.
These statistical concepts are essential for hand calculations in basic statistics classes.
Understanding these symbols is crucial for future modules in the course.
The video aims to provide a firm grasp of basic statistical notation.
The content is presented in an engaging and accessible manner.
Thank you for listening and learning about basic statistical notation.
Transcripts
Browse More Related Video

PROPERTIES OF SIGMA NOTATION || PRE-CALCULUS

Statistical Symbols
Statistical Notation
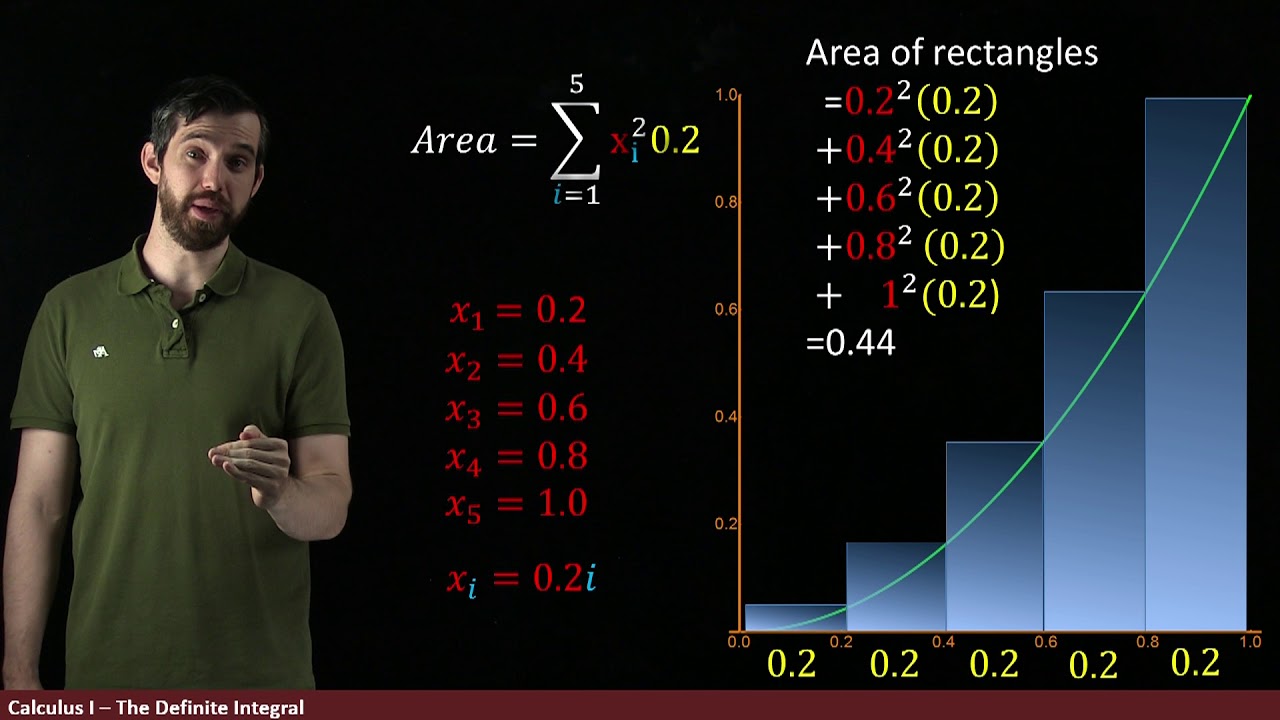
The Definite Integral Part II: Using Summation Notation to Define the Definite Integral

Stats with Professor B: A Basic Introduction to Summation Notation

How to calculate a regression equation, R Square, Using Excel Statistics
5.0 / 5 (0 votes)
Thanks for rating: