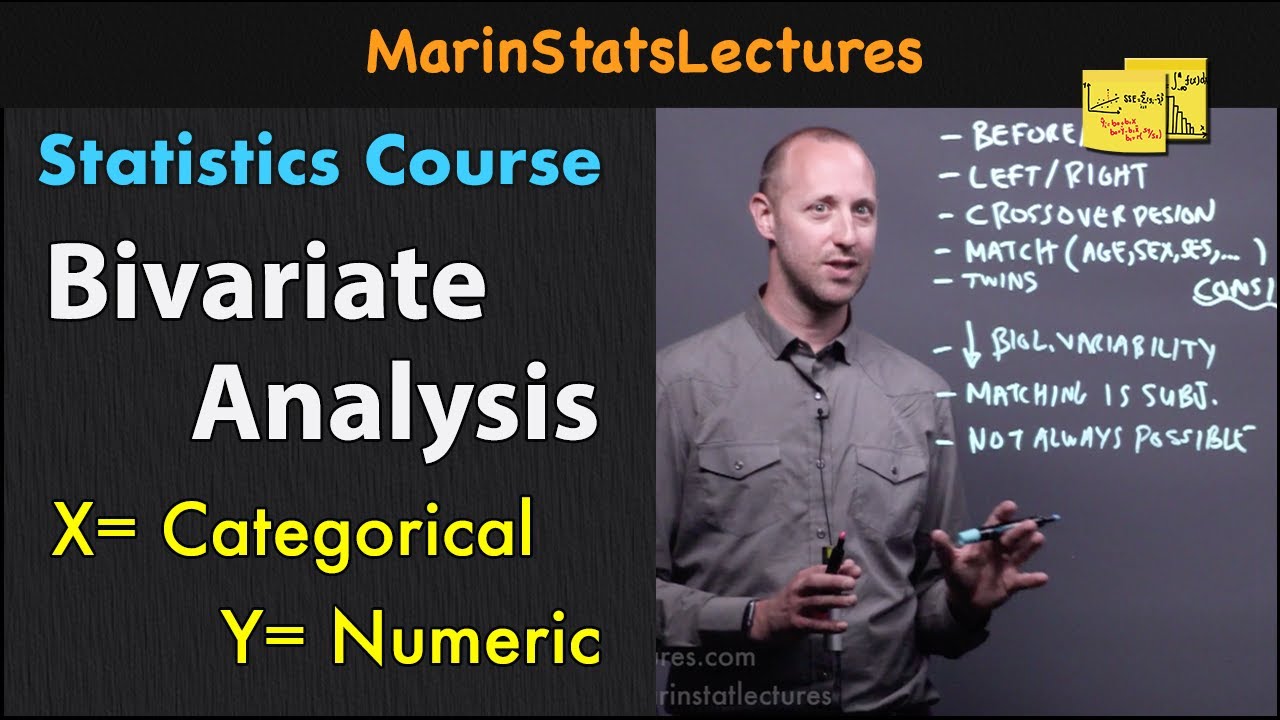
Bivariate Analysis Meaning | Statistics Tutorial #19 | MarinStatsLectures
TLDRThis video introduces bivariate analysis, focusing on the relationship between two variables, X and Y, and how changes in X affect Y. It explains the concepts of independent and dependent variables, and discusses various analysis methods such as parametric, nonparametric, and resampling approaches. The video also provides examples to illustrate different types of bivariate analysis, including two-sample t-tests, ANOVA, chi-squared tests, and correlation analyses, setting the stage for further exploration in upcoming videos.
Takeaways
- 📊 Bivariate analysis examines the relationship between two variables, typically focusing on how changes in one variable (X) affect another (Y).
- 🔍 Variables in bivariate analysis are often referred to as the independent variable (X) and the dependent variable (Y), with various other names used across disciplines.
- 🎯 The foundation of hypothesis testing and confidence intervals, including understanding the margin of error and p-values, is crucial for bivariate methods.
- 📈 Bivariate analysis can involve parametric, nonparametric, and resampling approaches, each with its own set of assumptions, strengths, and limitations.
- 🧪 Parametric methods assume normality, rely on larger sample sizes, and are sensitive to outliers, but offer powerful statistical tests and mathematical properties.
- 🔬 Nonparametric methods are suitable for smaller sample sizes, require fewer assumptions, and are robust to outliers, working with ranked data rather than actual values.
- 🔄 Resampling approaches, like bootstrapping, are flexible and make fewer assumptions than parametric methods, but do not result in smooth mathematical functions.
- 📝 Examples of bivariate analysis include comparing drug effects on blood pressure (categorical X, numeric Y), smoking and cancer (categorical X and Y), and education and salary (numeric X and Y).
- 📊 Visualization techniques for bivariate analysis vary by variable types and include side-by-side boxplots, bar plots, and scatter plots.
- 🧠 Bivariate analysis serves as a stepping stone to multivariable analysis, where the effects of multiple independent variables on a dependent variable are examined.
- 📚 The course structure plans to cover relationships between categorical variables, numeric variables, and lays the groundwork for multiple variable analysis in subsequent modules and courses.
Q & A
What is bivariate analysis?
-Bivariate analysis, also known as two-variable analysis, is a statistical method that examines the relationship or effect between two variables, specifically how changes in one variable (X) may affect another variable (Y).
What are the common names used for the X and Y variables in bivariate analysis?
-The X variable is often referred to as the independent variable, explanatory variable, predictor, or covariate. The Y variable is commonly called the dependent variable, outcome, or response.
What is the foundational concept behind confidence intervals?
-Confidence intervals are built on the concept that, under certain conditions, estimates generally stay within about two standard errors of the true value. The true value is usually within about two standard errors of the estimate.
How does the parametric approach differ from the nonparametric approach in statistical analysis?
-Parametric approaches have many assumptions, rely on larger sample sizes, and have higher statistical power. They also have nice mathematical properties and are sensitive to outliers. Nonparametric approaches work well with smaller sample sizes, make fewer assumptions, have lower power, and are not sensitive to outliers. They generally work with the ranking of observed data rather than the actual numeric values.
What is a resampling approach in statistical analysis?
-Resampling approaches, such as the bootstrap method, do not require large sample sizes and make fewer assumptions compared to parametric approaches. They are more flexible in the estimates that can be calculated or the hypotheses that can be tested, but they do not result in smooth mathematical functions like parametric approaches.
How can we visualize the relationship between a categorical X variable and a numeric Y variable?
-We can visualize the relationship between a categorical X variable and a numeric Y variable using side-by-side boxplots. For example, comparing the change in systolic blood pressure for two different drugs (Drug A and Drug B).
What statistical methods are appropriate for analyzing the relationship between two categorical variables?
-For analyzing the relationship between two categorical variables, we can use methods such as Pearson's chi-squared test, Fisher's exact test, rate ratios, or odds ratios.
What type of plot is useful for visualizing the relationship between two numeric variables?
-A scatter plot is useful for visualizing the relationship between two numeric variables, such as the relationship between years of education and salary.
What are Pearson's and Spearman's correlations?
-Pearson's and Spearman's correlations are statistical methods used to measure the strength and direction of the linear relationship between two variables. Pearson's correlation is used for normally distributed numeric data, while Spearman's correlation is used for ranked data or non-normal distributions.
What is simple linear regression?
-Simple linear regression is a statistical method that models the relationship between a single independent variable (X) and a dependent variable (Y) by fitting a linear equation to the observed data points.
What comes after bivariate analysis in the context of statistical learning?
-After bivariate analysis, the next step is usually multivariable analysis, where the effects of multiple independent variables (X1, X2, ..., Xk) on a single dependent variable (Y) are examined, and Y is modeled as a function of these multiple X variables.
Outlines
📊 Introduction to Bivariate Analysis
This paragraph introduces the concept of bivariate analysis, which involves examining the relationship between two variables. It explains that the independent variable (X) is often referred to by various names such as the explanatory, predictor, or covariate, while the dependent variable (Y) is known as the outcome, response, or sometimes just Y. The paragraph sets the stage for further discussions on bivariate methods by highlighting the importance of understanding how changes in X affect Y or using X to predict Y. It also briefly touches on the foundational concepts of hypothesis testing and confidence intervals, emphasizing the role of these concepts in the analysis of bivariate data.
🧪 Types of Bivariate Analysis and Examples
This paragraph delves into the types of bivariate analysis, providing examples to illustrate different scenarios. It discusses parametric and nonparametric approaches, their assumptions, strengths, and weaknesses. The paragraph also introduces resampling approaches like bootstrapping, which offer flexibility with fewer assumptions. It presents three examples: the effect of a drug on blood pressure, the relationship between smoking and cancer, and the correlation between years of education and salary. Each example is used to demonstrate the appropriate bivariate analysis methods, such as t-tests, ANOVA, chi-squared tests, and correlation analyses, setting the stage for more in-depth discussions in subsequent videos.
Mindmap
Keywords
💡Bivariate Analysis
💡Independent Variable (X)
💡Dependent Variable (Y)
💡Hypothesis Testing
💡Confidence Interval
💡Parametric Approaches
💡Nonparametric Approaches
💡Resampling Approaches
💡Categorical Variable
💡Numeric Variable
💡Correlation
Highlights
Introduction to bivariate analysis and its focus on examining the relationship between two variables, X and Y.
Explanation of the X variable as the independent, explanatory, predictor, or covariate, and Y as the dependent, outcome, or response variable.
Foundation of hypothesis testing and confidence intervals, with confidence intervals typically taking the form of estimate plus or minus a margin of error.
The concept that estimates usually stay within two standard errors of the true value under certain conditions.
Discussion on parametric, nonparametric, and resampling approaches, each with their own advantages and limitations.
Parametric approaches assuming normal data, relying on larger sample sizes, and being sensitive to outliers.
Nonparametric approaches being suitable for smaller sample sizes, making fewer assumptions, and being robust to outliers.
Resampling approaches like bootstrapping, which are flexible, make fewer assumptions, and do not require large sample sizes.
Example of analyzing the effect of a drug (categorical X) on systolic blood pressure change (numeric Y) using methods like two-sample t-tests and ANOVA.
Visualization of categorical vs. categorical data relationship through side-by-side bar plots and analysis methods like chi-squared tests and Fisher's exact test.
Numeric vs. numeric variable analysis using scatter plots and methods such as correlation and simple linear regression.
Transition from bivariate to multivariable analysis, where the effect of multiple X variables on an outcome Y is examined.
Course structure overview, with modules 5 to 8 dedicated to exploring relationships between different types of variables, and a second course covering multivariable methods.
Encouragement for viewers to subscribe and share for more content on statistical analysis methods.
Transcripts
Browse More Related Video

Elementary Stats Lesson #5
Bivariate Analysis for Categorical & Numerical | Statistics Tutorial #20 | MarinStatsLectures
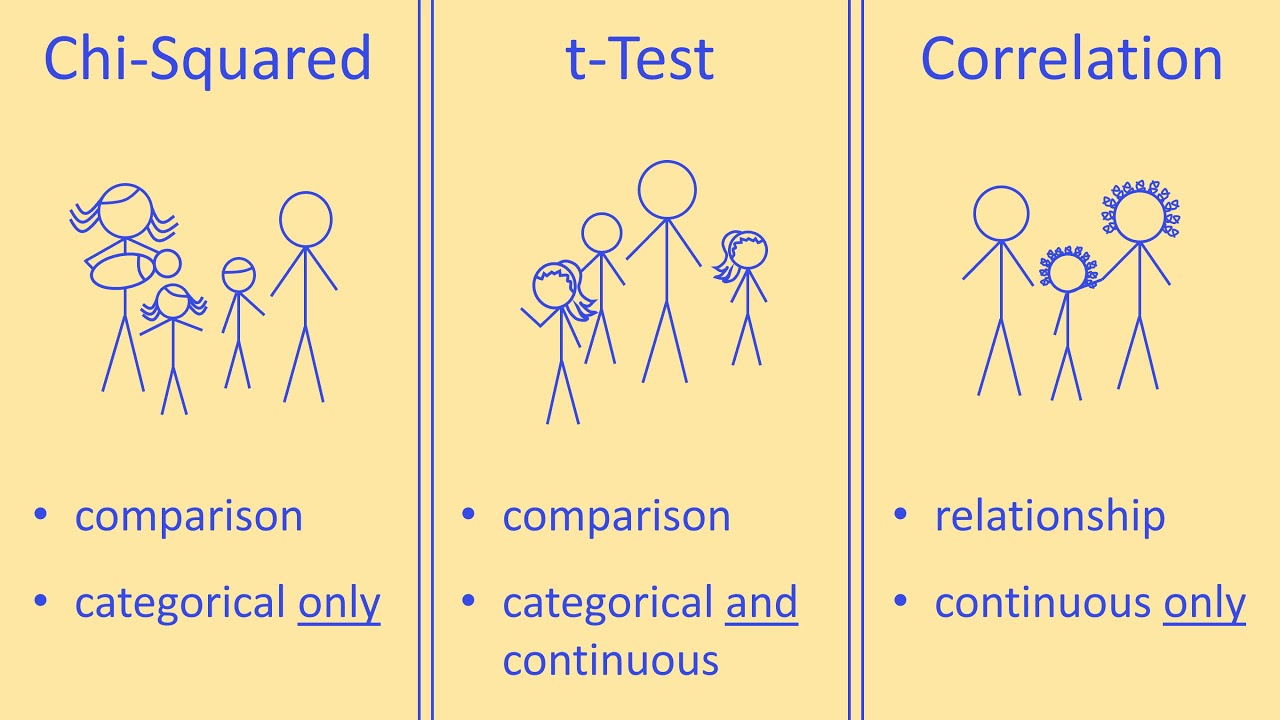
Statistics made easy ! ! ! Learn about the t-test, the chi square test, the p value and more
Choosing a Statistical Test for Your IB Biology IA

How To Know Which Statistical Test To Use For Hypothesis Testing
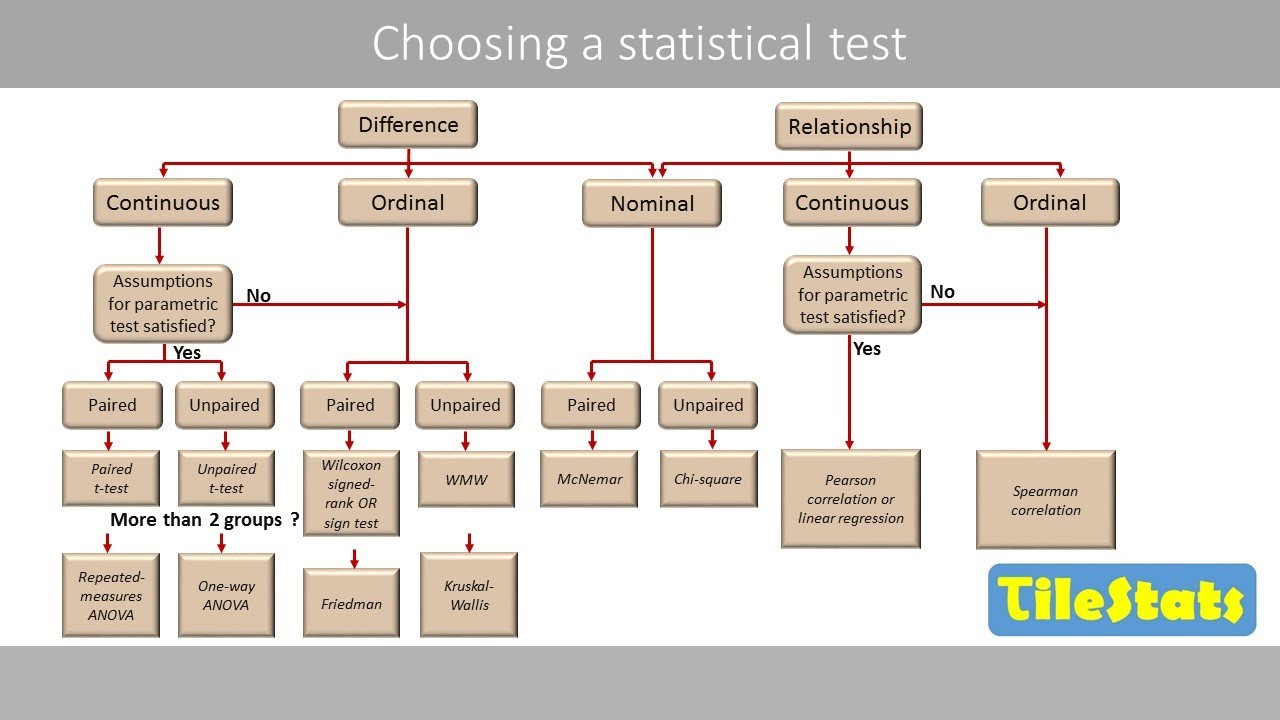
How to choose an appropriate statistical test
5.0 / 5 (0 votes)
Thanks for rating: