Bivariate Analysis for Categorical & Numerical | Statistics Tutorial #20 | MarinStatsLectures
TLDRThe video discusses the analysis of relationships between categorical (X) and numeric (Y) variables, focusing on the differences between paired (dependent) and independent groups. It explores examples such as before/after experiments, left-right comparisons, and crossover designs for paired data, contrasting them with independent scenarios like smokers vs. non-smokers. The pros of pairing, like reducing biological variability, and considerations for independent groups, such as ensuring group similarity, are highlighted. The video concludes with an overview of potential analytical methods, including t-tests, ANOVA, and nonparametric alternatives, depending on whether the groups are paired or independent and the number of groups involved.
Takeaways
- 📊 Visualizing the relationship between categorical (X) and numeric (Y) variables often involves side-by-side box plots.
- 🔍 When analyzing data, consider whether you are comparing two groups or three or more, and if the individuals within these groups are independent or dependent.
- 🧪 Paired or dependent data can arise from before/after experiments, left-right experiments, crossover designs, or matching on specific variables.
- 💡 Paired designs decrease biological variability by comparing the same individual under different conditions, thus controlling for individual differences.
- 🧬 Twins are often used in paired data studies to control for genetic and environmental factors, aiming to isolate the effect of the treatment.
- 🔄 In independent group studies, it's crucial to ensure that the groups are similar across all variables except for the one being studied to avoid confounding factors.
- 🎯 Matching, randomization, and restriction are strategies to create comparable groups in independent studies, though these may affect generalizability.
- 📈 For two paired groups, statistical methods like the paired t-test and Wilcoxon signed-rank test are used, with the former being parametric and the latter nonparametric.
- 📊 For three or more paired groups, repeated measures ANOVA or Friedman's test can be applied, offering parametric and nonparametric options respectively.
- 🔢 When comparing two independent groups, the two-sample t-test or Wilcoxon rank-sum test (Mann-Whitney U) are considered, offering similar parametric and nonparametric approaches.
- 📈 For three or more independent groups, one-way ANOVA or Kruskal-Wallis test are the starting points for parametric and nonparametric analyses, respectively.
Q & A
What is the main focus of the transcript?
-The main focus of the transcript is to discuss the relationship between categorical variable X and numeric variable Y, and to explore different methods of data analysis based on whether the groups being compared are paired or independent.
How does the speaker suggest visualizing data involving categorical and numeric variables?
-The speaker suggests visualizing such data by looking at side-by-side box plots.
What are some examples of paired or dependent data designs mentioned in the transcript?
-Examples of paired or dependent data designs include before/after experiments, left-right experiments (comparing two treatments on different sides of the same individual), crossover designs, and matching based on certain variables like age, sex, or socioeconomic status.
What are the advantages of using paired designs in data analysis?
-Paired designs decrease biological variability by comparing the same individual under different conditions, which can help to isolate the effect of the treatment or intervention being studied.
What are some considerations when using paired data in analysis?
-Considerations include ensuring that the factors being matched on are relevant and important, recognizing that finding good matches is not always easy, and acknowledging that some forms of pairing, like using twins, may not always be feasible.
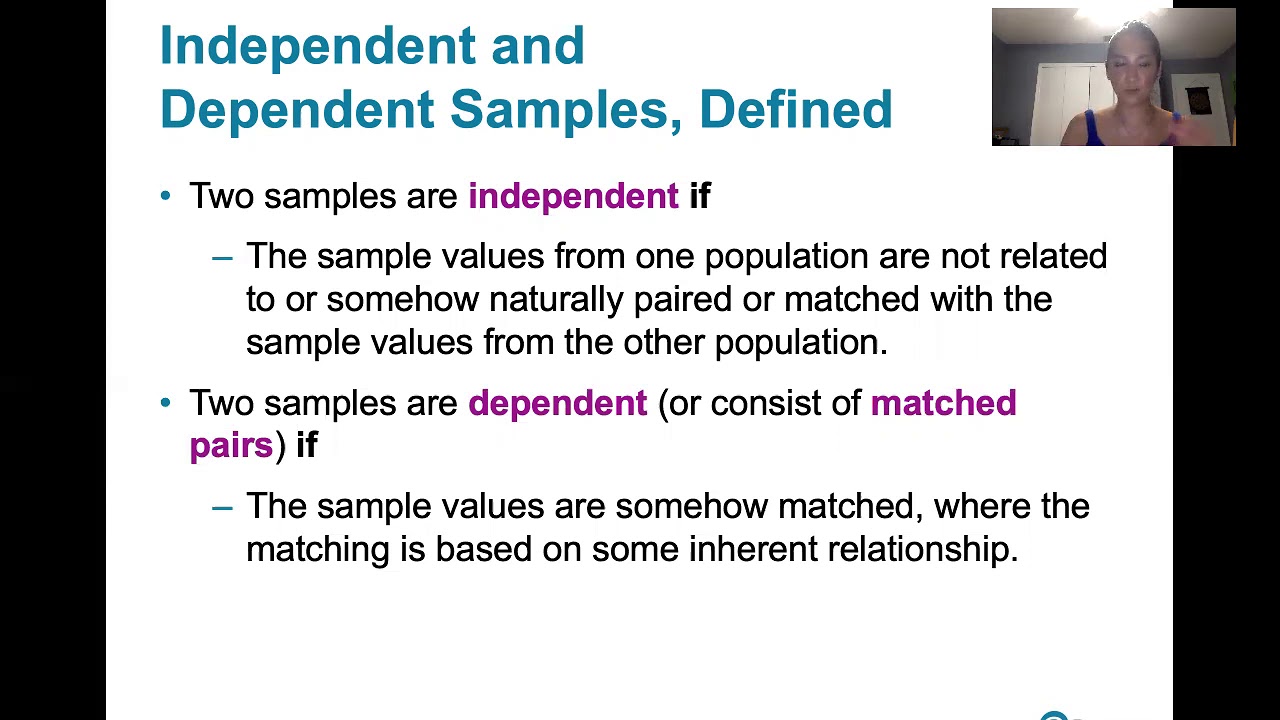
How does the transcript differentiate between independent and paired groups?
-Independent groups involve different individuals in each group, such as comparing smokers and non-smokers. Paired groups involve the same individual in different conditions or matched individuals, such as comparing different treatments on the same person or matching individuals based on certain characteristics.
What are some challenges in analyzing independent group data?
-Challenges include ensuring that the groups are similar in all aspects except for the variable of interest, which may require randomization, restriction, or statistical adjustment to account for potential confounding factors.
What statistical tests are suggested for comparing two paired groups?
-For comparing two paired groups, the transcript suggests using a paired t-test as a parametric approach and the Wilcoxon signed-rank test as a nonparametric alternative.
What are the starting points for analyzing three or more paired groups?
-For three or more paired groups, the starting points mentioned are repeated measures analysis of variance (ANOVA) for parametric analysis and Friedman's test for nonparametric analysis.
What methods are discussed for comparing two independent groups?
-For comparing two independent groups, the transcript discusses using a two-sample t-test for parametric analysis and the Wilcoxon rank-sum test (also known as the Mann-Whitney U test) for nonparametric analysis.
How does the transcript address the analysis of three or more independent groups?
-For three or more independent groups, the transcript suggests starting with one-way analysis of variance (ANOVA) for parametric analysis and Kruskal-Wallis one-way analysis of variance for nonparametric analysis.
Outlines
📊 Understanding Paired and Independent Groups in Data Analysis
This paragraph introduces the concept of analyzing relationships between categorical (X) and numeric (Y) variables. It emphasizes the importance of visualizing data through side-by-side box plots and considering whether the analysis involves comparing two groups or more, and whether the individuals within these groups are independent or related (paired). The discussion includes examples of paired designs, such as before/after experiments, left-right experiments, crossover designs, and matching, contrasting these with independent groups where individuals belong to separate groups, exemplified by comparing smokers and non-smokers or male versus female body temperatures.
🧠 Advantages and Considerations of Paired Data
The second paragraph delves into the advantages of paired data, such as reducing biological variability by comparing the same individual under different conditions. It also discusses the challenges of finding good matches, the subjectivity of matching factors, and the limitations of pairing, especially when it comes to independent variables. The paragraph highlights the use of twins as an ideal example of paired data to minimize biological variability, and it contrasts this with the considerations needed when analyzing independent groups, such as ensuring group similarity and addressing potential confounding factors through randomization, restriction, or statistical adjustment.
📈 Overview of Analysis Methods for Paired and Independent Groups
The final paragraph provides an overview of different analytical methods based on whether the groups are paired or independent and the number of groups being compared. For two paired groups, it suggests using a paired t-test or the nonparametric Wilcoxon signed-rank test. For three or more paired groups, it recommends repeated measures ANOVA or Friedman's test. For independent groups, the starting points are the two-sample t-test or the Wilcoxon rank-sum test for two groups, and one-way ANOVA or Kruskal-Wallis test for three or more groups. The paragraph also mentions the potential use of bootstrapping methods and encourages viewers to stay tuned for in-depth discussions on these tests in subsequent videos.
Mindmap
Keywords
💡Categorical Variable
💡Numeric Variable
💡Paired Design
💡Independent Groups
💡Biological Variability
💡Matching
💡Crossover Design
💡Repeated Measures Analysis of Variance (ANOVA)
💡Two-Sample T-Test
💡Wilcoxon Signed-Rank Test
💡One-Way Analysis of Variance (ANOVA)
Highlights
The discussion focuses on the relationship between categorical variable X and numeric variable Y.
Visualizing data through side by side box plots is suggested for analysis.
The decision on analysis methods depends on whether we're comparing two groups or three or more.
The importance of determining if individuals in a group are independent or dependent/paired.
Paired design examples include before/after experiments and left-right experiments.
Crossover designs and matching are also methods of obtaining paired data.
Independent groups involve different people in each group, such as smokers vs. non-smokers.
Pairing decreases biological variability, which is a pro of this design.
Matching in paired data should be based on relevant factors to ensure comparability.
Using twins in experiments is an effective way to obtain paired data.
For independent groups, it's crucial to ensure groups are similar to avoid confounding factors.
Randomization and restriction can help control for confounding factors in independent group studies.
Statistical adjustments can be made to make independent groups more similar.
Analyses for paired groups include paired t-test and Wilcoxon signed-rank test.
Repeated measures ANOVA and Friedman's test are for comparing three or more paired groups.
Two-sample t-test and Wilcoxon rank-sum test are for comparing two independent groups.
One-way ANOVA and Kruskal-Wallis test are for comparing three or more independent groups.
Bootstrapping methods can also be used for analysis, which will be covered in subsequent videos.
Transcripts
Browse More Related Video
9.2.1 Two Means, Independent Samples - Independent and Dependent Samples
One sample t-test vs Independent t-test vs Paired t-test

SPSS (9): Mean Comparison Tests | T-tests, ANOVA & Post-Hoc tests

t-Test - Full Course - Everything you need to know

Bivariate Analysis Meaning | Statistics Tutorial #19 | MarinStatsLectures
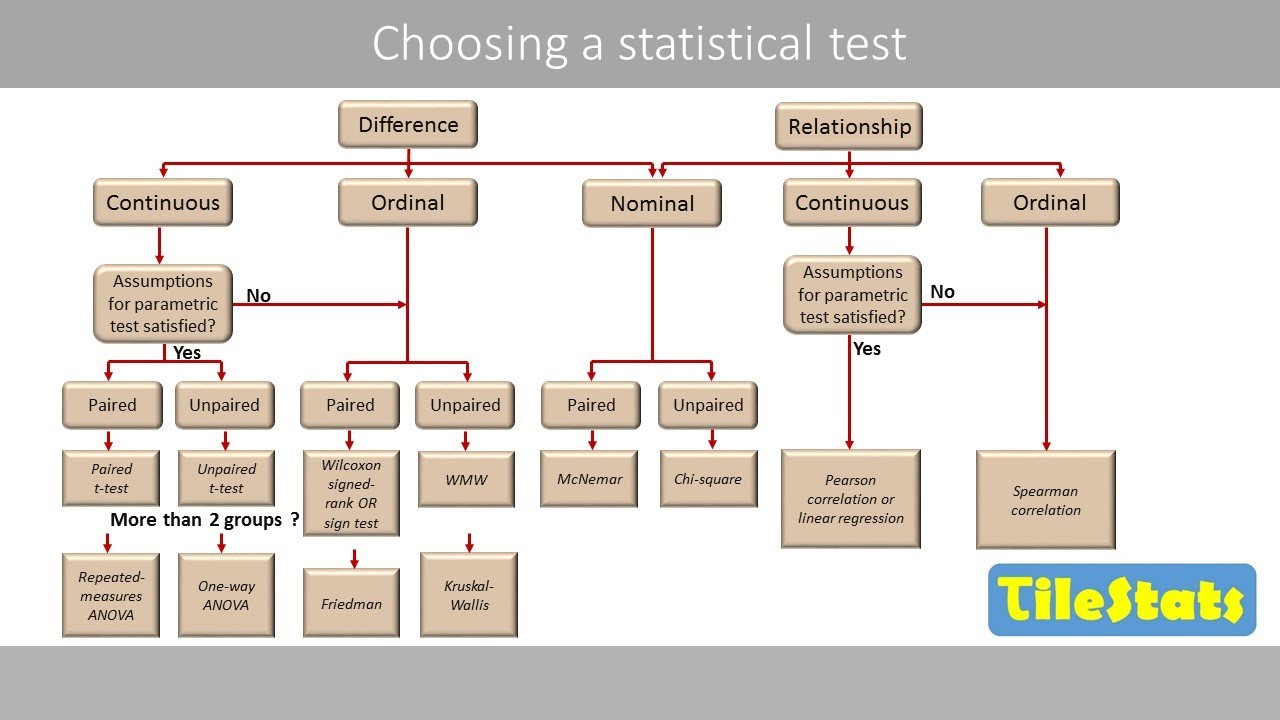
How to choose an appropriate statistical test
5.0 / 5 (0 votes)
Thanks for rating: