One-tailed and two-tailed tests | Inferential statistics | Probability and Statistics | Khan Academy
TLDRThis video script discusses the concepts of null and alternative hypotheses in statistical testing, with a focus on two-tailed versus one-tailed tests. It explains that a two-tailed test is used when the drug's effect could be either positive or negative, while a one-tailed test is chosen when there's a specific expectation, such as the drug lowering response times. The script uses the example of a drug's effect on response time, illustrating how to calculate and interpret P-values for both test types, emphasizing the significance of rejecting the null hypothesis when the P-value is very low.
Takeaways
- 🔍 The script discusses the concept of hypothesis testing, specifically focusing on the null and alternative hypotheses in a drug study.
- 💊 The null hypothesis posits that the drug has no effect, meaning the mean response time with the drug is the same as the population mean.
- 🌐 The alternative hypothesis suggests that the drug has an effect, implying the mean response time could be different from the population mean.
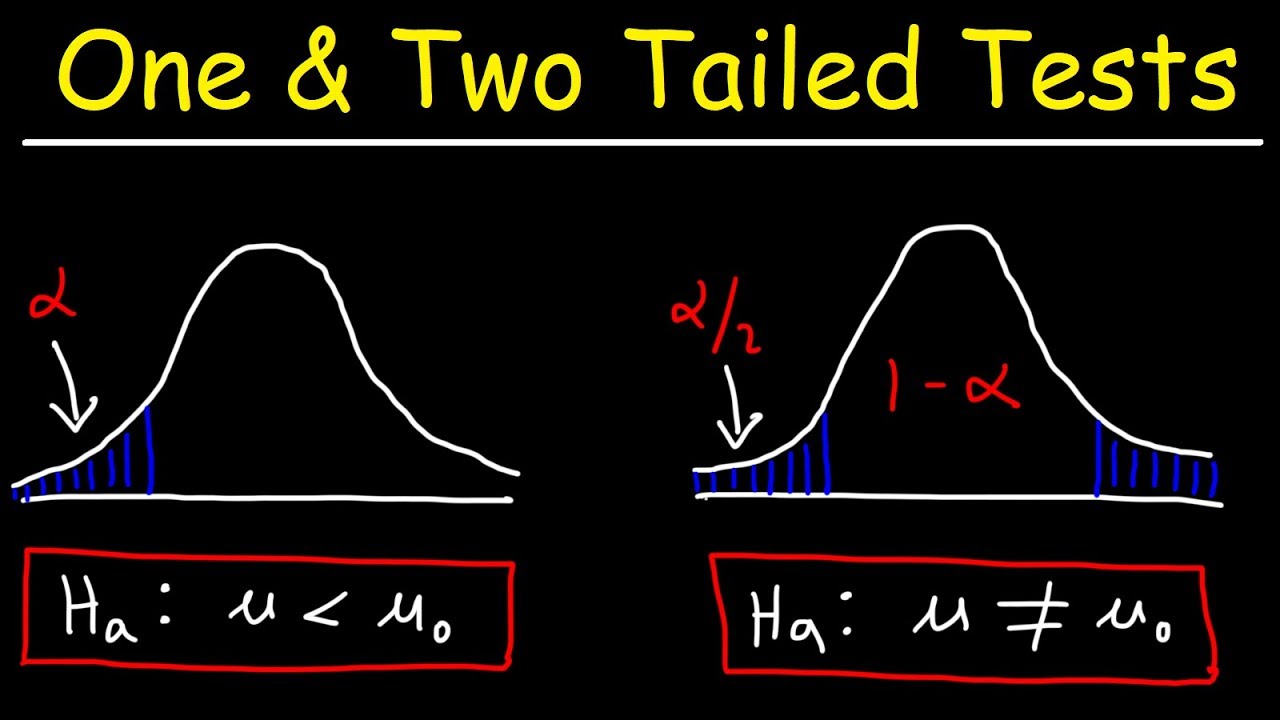
- 📊 A two-tailed test is introduced, which considers both extremes of the distribution, indicating the drug could have either a positive or negative effect.
- 📚 The script explains that a response time more than 3 standard deviations away could lead to rejecting the null hypothesis, which applies to both tails of the distribution.
- 📉 The concept of a one-tailed test is also presented, where the focus is only on one direction of the effect, such as the drug lowering response time.
- 📝 Different notations for the alternative hypothesis are mentioned, such as H1 or H_alternative, indicating flexibility in academic notation.
- 📈 The sampling distribution of the sample mean is discussed, emphasizing its mean and standard deviation, which are crucial for hypothesis testing.
- 📊 The result of the drug study, a sample mean of 1.05 seconds, is described as being 3 standard deviations below the mean, a significant finding.
- 🤔 The script explores the probability of obtaining a result as extreme as observed if the null hypothesis were true, focusing on the tail relevant to the one-tailed test.
- 📝 The P-value is introduced as a measure of the probability of observing such an extreme result under the null hypothesis, in this case, 0.0015.
- 🚫 Given the low P-value, it is concluded that the null hypothesis would be rejected, and the alternative hypothesis is supported, indicating the drug has a significant effect on lowering response time.
Q & A
What is a null hypothesis in the context of the video?
-In the video, the null hypothesis is the assumption that the drug has no effect, meaning the mean response time with the drug is the same as the population mean.
What is the alternative hypothesis in the described experiment?
-The alternative hypothesis is that the drug has an effect, suggesting that the mean response time with the drug will be different from the population mean, without specifying whether it will be higher or lower.
What is a two-tailed test and why was it used in this experiment?
-A two-tailed test is used when the effect of the drug could be in either direction, increasing or decreasing the response time. It was used here because the researchers were interested in any significant change in response time, not just in one direction.
How does a one-tailed test differ from a two-tailed test?
-A one-tailed test focuses on one direction of effect (either higher or lower), whereas a two-tailed test considers both directions. In the video, a one-tailed test would only consider the possibility of the drug lowering response time.
What does it mean if the drug's effect is considered 'extreme' in the context of hypothesis testing?
-An 'extreme' effect refers to a result that is significantly different from the null hypothesis prediction, such as a response time that is more than 3 standard deviations away from the mean.
What is the significance of the P-value in hypothesis testing?
-The P-value represents the probability of obtaining a result as extreme or more extreme than the one observed, assuming the null hypothesis is true. A small P-value suggests strong evidence against the null hypothesis.
How does the sample size affect the ability to use a normal distribution for the sampling distribution of the sample mean?
-If the sample size is greater than 30, the Central Limit Theorem allows us to approximate the sampling distribution of the sample mean with a normal distribution, which is necessary for hypothesis testing.
What is the difference between the notation H1 and Ha for the alternative hypothesis?
-H1 and Ha are both used to denote the alternative hypothesis, with no difference in meaning. The choice between them is a matter of preference or convention.
What is the significance of the sample mean being 3 standard deviations below the population mean?
-This indicates that the sample mean is an extreme value in the context of the normal distribution. It is a result that is unlikely to occur if the null hypothesis were true, suggesting a strong effect of the drug.
How does the video explain the concept of 'more extreme' in the context of a one-tailed test?
-In a one-tailed test, 'more extreme' refers to results that are in the direction of the alternative hypothesis, which in the video's case is a lower response time due to the drug.
What is the probability of getting a result lower than 1.05 seconds if the null hypothesis is true?
-Assuming the null hypothesis is true, the probability of getting a result lower than 1.05 seconds, which is 3 standard deviations below the mean, is approximately 0.15% or 0.0015.
Outlines
🔬 Hypothesis Testing: Two-Tailed vs. One-Tailed Tests
This paragraph discusses the concept of hypothesis testing in the context of a drug's effect on response times. It explains the difference between a two-tailed test, where the drug could have either a positive or negative effect, and a one-tailed test, where the focus is on a specific direction of the effect, such as a reduction in response time. The speaker uses the example of a drug that might either significantly increase or decrease response times, both of which would be considered an 'effect.' The paragraph also introduces the concept of P-values and how they are used to determine the likelihood of observing the test result under the null hypothesis, with the example of a result being 3 standard deviations below the mean.
📊 Understanding One-Tailed Test Significance and P-Values
The second paragraph delves deeper into the specifics of a one-tailed test, emphasizing the directional nature of the hypothesis that the drug lowers response time. It explains how the significance of the test is determined by the area under the normal distribution curve in the tail that corresponds to the direction of the effect being tested. The paragraph provides a numerical example, calculating the P-value as 0.0015, which represents the probability of observing a sample mean 3 standard deviations below the population mean if the null hypothesis were true. This low P-value suggests strong evidence against the null hypothesis, leading to its rejection in favor of the alternative hypothesis that the drug indeed lowers response time.
Mindmap
Keywords
💡Null Hypothesis
💡Alternative Hypothesis
💡Two-Tailed Test
💡One-Tailed Test
💡Response Time
💡Standard Deviation
💡Sampling Distribution
💡P-Value
💡Statistical Significance
💡Effect Size
💡Rejection of Null Hypothesis
Highlights
The null hypothesis was that the drug had no effect on response time.
The alternative hypothesis was that the drug has an effect, without specifying if it increases or decreases response time.
A two-tailed test was conducted to determine if the drug has any effect, positive or negative.
A response time more than 3 standard deviations away could also lead to rejecting the null hypothesis.
A one-tailed test could be used if there is a belief that the drug will lower response times.
The one-tailed test alternative hypothesis states the drug lowers response time, with a mean less than 1.2 seconds.
The sampling distribution of the sample mean was used, with a mean of 1.2 seconds, the same as the population mean.
The sample mean of 1.05 seconds was 3 standard deviations below the mean.
In a one-tailed test, only results lower than 1.05 seconds are considered more extreme.
The probability of getting a result more extreme than 1.05 seconds in a one-tailed test is 0.0015 or 0.15%.
If the null hypothesis is correct, there is only a 0.15% chance of getting a result lower than 1.05 seconds.
The P-value of 0.0015 indicates it is very unlikely to get such a low result if the null hypothesis is true.
The null hypothesis is rejected in favor of the alternative hypothesis due to the low P-value.
The video explains the difference between two-tailed and one-tailed hypothesis tests.
The video demonstrates how to set up and interpret one-tailed hypothesis tests.
The video uses a concrete example of drug effects on response time to illustrate hypothesis testing.
The importance of specifying the direction of the effect in the alternative hypothesis is emphasized.
The video explains how to calculate and interpret P-values in the context of hypothesis testing.
The video provides a clear step-by-step guide on conducting a one-tailed hypothesis test.
Transcripts
Browse More Related Video
One Tailed and Two Tailed Tests, Critical Values, & Significance Level - Inferential Statistics

t-Test - Full Course - Everything you need to know
Hypothesis testing: step-by-step, p-value, t-test for difference of two means - Statistics Help

Meaning of P-value and Alpha

Elementary Stats Lesson #18
Elementary Statistics Chapter 8 - Introduction Hypothesis Testing Part 1 Lesson 1
5.0 / 5 (0 votes)
Thanks for rating: