Creating a slope field | First order differential equations | Khan Academy
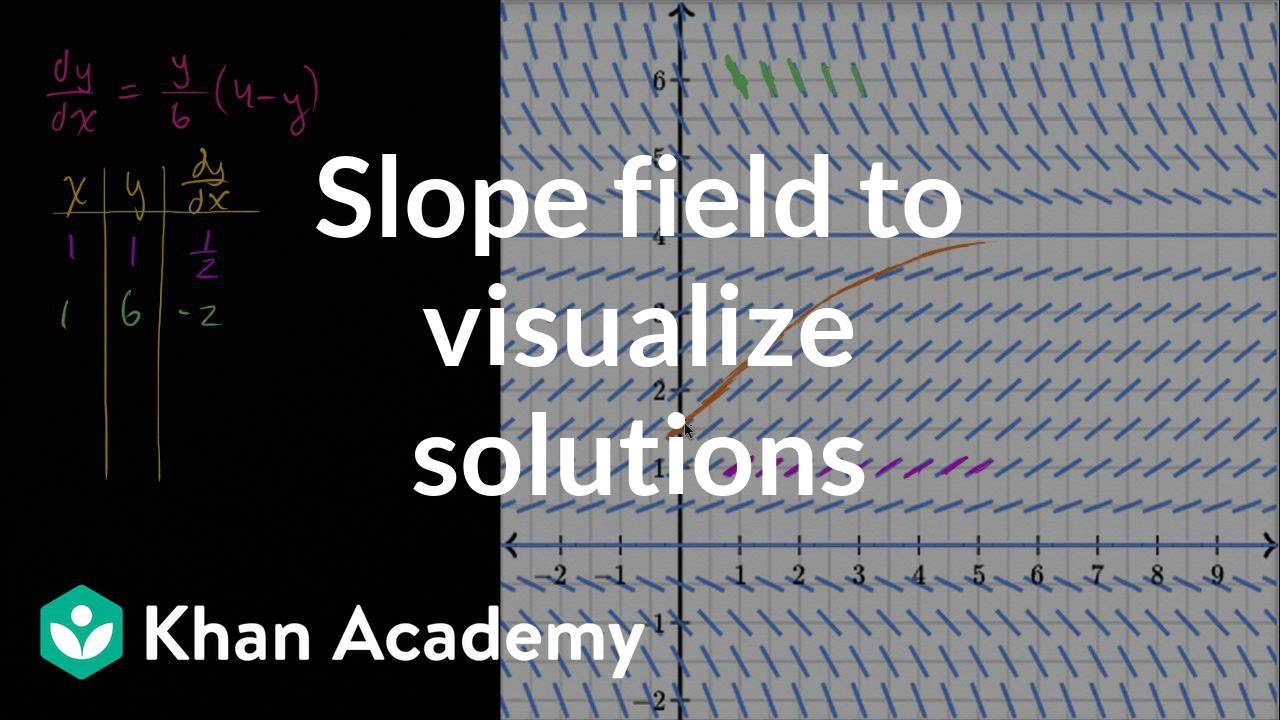
TLDRThe video script introduces a method to visualize solutions of a given differential equation without solving it. By plotting points on a coordinate plane and calculating the slope of the tangent at these points using the differential equation dy/dx = -x/y, the video creates a slope field. This visual representation helps to understand the behavior of potential solutions, suggesting the shape of the function based on the slopes at various points. The concept is engaging and provides a geometrical insight into differential equations.
Takeaways
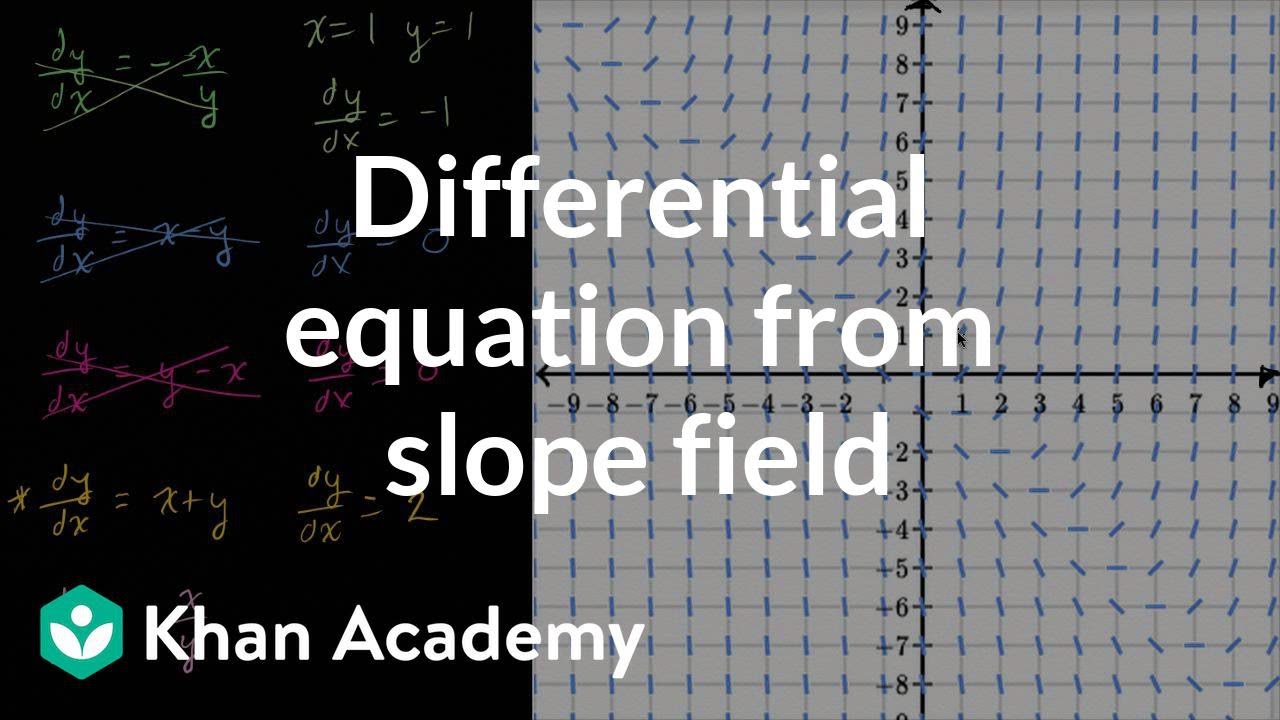
- 📝 The given differential equation is dy/dx = -x/y, which describes the rate of change of y with respect to x.
- 🔍 Visualization of solutions can be done by understanding the slope of the solution at various points on the coordinate plane.
- 🌟 By plotting points and calculating their slopes (dy/dx), we can infer the shape of the solution curves.
- 📊 A table can be used to sample x and y values and determine the corresponding slopes (dy/dx).
- 👀 At the point (0,1), the slope of the solution is zero, as the derivative is -0/1, which visualizes as a horizontal line segment.
- 🔄 At the point (1,1), the slope is negative one (-1/1), and at (1,0), the slope is undefined, hinting at a vertical tangent.
- 📐 The point (-1,-1) and (1,-1) both have a slope of -1, while (1,-1) has a slope of 1, showcasing the symmetry in the slope field.
- 🔼 The process of plotting points and their slopes on the coordinate plane is called creating a slope field.
- 🧠 The slope field provides insights into the behavior of the solutions to the differential equation.
- 🎥 The video script serves as an introduction to the concept of slope fields and their role in visualizing differential equations.
- 🚀 Further videos will delve deeper into the concept, providing a more comprehensive understanding of slope fields and their applications.
Q & A
What is the given differential equation in the script?
-The given differential equation is dy/dx = -x/y.
How does the script suggest visualizing solutions to differential equations?
-The script suggests visualizing solutions by plotting points on a coordinate plane, calculating their slopes using the differential equation, and then drawing line segments with those slopes to form a visual 'slope field'.
What happens when the script attempts to calculate the derivative at the point (0,1)?
-At the point (0,1), the derivative of y with respect to x is -0/1, which is zero. This means the slope of the solution at this point is zero, and it is represented by a horizontal line segment.
What is the slope of the solution at the point (1,1) according to the script?
-At the point (1,1), the slope of the solution is -1, as calculated by the derivative -1/1. This is represented by a line segment with a slope of -1.
Why is the slope undefined at the point (1,0)?
-The slope is undefined at the point (1,0) because the denominator in the expression -x/y becomes zero, which leads to an undefined value. The script suggests this might indicate a vertical tangent line at that point.
What does the script imply about the behavior of solutions as x and y both become negative?
-The script implies that when both x and y are negative, the solutions have a slope of -1. Conversely, when x and y are both positive, the slope is also -1, indicating that the solutions curve in a similar manner in these quadrants.
How does the script use the concept of a slope field to understand differential equations?
-The script uses the concept of a slope field to provide a visual representation of the possible slopes of solutions at various points in the coordinate plane. This helps to form an intuitive understanding of the behavior of solutions without explicitly solving the differential equation.
What is the purpose of the table the script sets up to sample x and y values?
-The purpose of the table is to systematically sample points on the coordinate plane and calculate the corresponding slopes using the differential equation. This allows for the construction of the slope field, which helps in visualizing the behavior of potential solutions.
How does the script demonstrate the concept of a vertical tangent line?
-The script demonstrates the concept of a vertical tangent line by discussing the undefined slope at the point (1,0), where the derivative calculation results in division by zero. It suggests that if a solution passed through this point, the tangent might be vertical.
What is the significance of the slope field in understanding differential equations?
-The slope field is significant as it provides a visual tool to understand the behavior of solutions to a differential equation. By plotting the slopes at various points, one can infer the shape and direction of the solutions, which can aid in understanding the dynamics of the system described by the differential equation.
How does the script suggest that solutions might behave in the first and third quadrants?
-The script suggests that in the first and third quadrants, where both x and y are positive or negative, the solutions might curve in a similar manner. This is inferred from the consistent slope of -1 observed at points such as (1,1) and (-1,-1).
Outlines
📈 Visualizing Solutions of a Differential Equation
This paragraph introduces a method for visualizing the solutions of a given differential equation, dy/dx = -x/y. The speaker explains that by plotting points on a coordinate plane and substituting these points into the differential equation, one can determine the slope of the solution at each point. This is visualized by drawing line segments with the corresponding slopes. The process is demonstrated with several examples, such as (0,1), (1,1), and (1,0), leading to insights about the behavior of the solutions, including the possibility of a vertical slope at certain points. The concept of a slope field is introduced as a tool for understanding the overall structure of the solutions to the differential equation.
🌐 Further Exploration of the Slope Field
The speaker continues the discussion on the slope field, emphasizing its utility in visualizing the behavior of solutions to differential equations. By using the slope field, the speaker sketches potential shapes of solutions based on the slopes indicated by the field. The paragraph suggests that the slope field can guide the understanding of how solutions might evolve, and the speaker hints at deeper exploration of this concept in subsequent videos, promising a more comprehensive understanding of slope fields and their applications in solving differential equations.
Mindmap
Keywords
💡differential equation
💡derivative
💡coordinate plane
💡slope
💡slope field
💡visualization
💡undefined
💡sample points
💡vertical tangent
💡function
💡relation
Highlights
The differential equation given is dy/dx = -x/y.
The goal is to understand the solutions without necessarily solving the equation.
Visualization is achieved by examining the coordinate plane and plotting sample points.
The slope of a solution at any point can be determined by substituting the x and y coordinates into the differential equation.
A table is set up to sample x and y values and calculate their derivatives (dy/dx).
At the point (0,1), the slope of a solution is zero, as -0/1 equals zero.
At the point (1,1), the slope is negative one, as -1/1 equals -1.
The point (1,0) suggests an undefined slope, which might indicate a vertical tangent line.
At the point (-1,-1), the slope is negative one, as -(-1)/(-1) equals 1.
At the point (1,-1), the slope is positive one, as -1/-1 equals 1.
At the point (-2,-2), the slope is also positive one, as -(-2)/(-2) equals 1.
At the point (2,-2), the slope is negative one, as -2/(-2) equals -1.
By plotting these slopes, a visual representation of the solution's path begins to form.
The method of plotting slopes based on sample points is called a slope field.
The slope field provides insights into the behavior of solutions to the differential equation.
The video aims to provide a basic understanding of slope fields and their role in visualizing solutions to differential equations.
Transcripts
Browse More Related Video
Slope field to visualize solutions | First order differential equations | Khan Academy
Calculus AB/BC – 7.3 Sketching Slope Fields
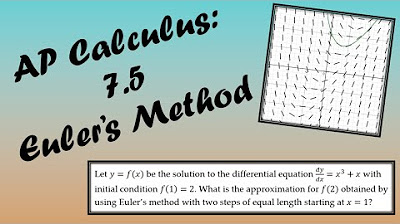
AP Calculus BC Lesson 7.5
Calculus 1: Slope Fields Examples

AP Calculus AB: Lesson 7.2 Slope Fields
Differential equation from slope field | First order differential equations | Khan Academy
5.0 / 5 (0 votes)
Thanks for rating: