Calculus 1: Slope Fields Examples
TLDRThis video script discusses the concept of slope fields in differential equations, focusing on sketching the derivatives at each point within a given square grid. The instructor demonstrates how to plot the slope field for the equation y' = y - x, by calculating and drawing the slope at various points on the grid. Key points where the slope is zero are identified, which helps in matching the correct slope field to the given differential equation. The script also briefly touches on the slope field for a sine function, illustrating how it varies only with y. The instructor emphasizes the importance of identifying points with zero slopes for easy equation matching and provides a resource for further learning.
Takeaways
- 📉 Slope fields represent the derivatives at each point rather than plotting each point directly on the XY axes.
- 📝 To sketch a slope field, take the XY axes and plot from negative 2 to 2 on both axes.
- 🔄 The slope (Y') is calculated as Y - X at each point on the grid.
- 📍 At the origin (0,0), the slope is 0 because Y - X equals 0.
- 📈 At point (0,1), the slope is 1, indicating a positive slope line.
- 📉 As Y decreases, the slope values become negative, reflecting downward slopes.
- 🔢 Each point on the grid requires plugging in values for X and Y to determine the corresponding slope.
- 🔍 For sine functions, slope values depend on the sine of Y and are 0 at integer multiples of π.
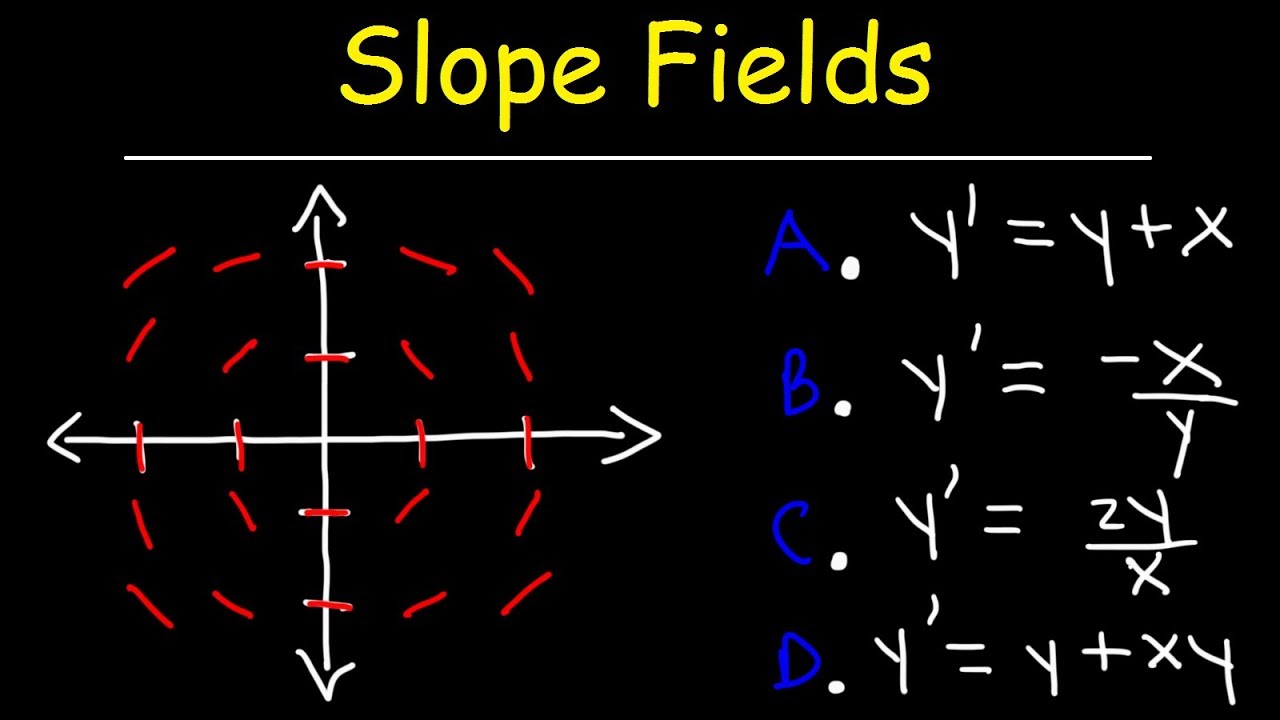
- 💡 Matching slope fields to differential equations involves identifying points where the slope is zero and matching these to the equations.
- 🌐 Additional resources and practice problems are available on the presenter's website.
Q & A
What is the purpose of a slope field in the context of differential equations?
-A slope field is a graphical representation used to visualize the solutions of a first-order differential equation. It consists of short line segments, each representing the slope of the solution at a particular point in the xy-plane.
What is the general equation given for the slope field in the script?
-The general equation given for the slope field in the script is y' = dy/dx = y - x.
How is the slope field constructed in the provided script?
-The slope field is constructed by plotting the derivatives at each point within a grid defined by the x and y axes, ranging from negative 2 to 2 in both directions.
What does a horizontal hashed line in the slope field represent?
-A horizontal hashed line in the slope field represents a slope of 0, indicating that at that particular point, the derivative (rate of change) is zero.
What is the slope at the point (0,0) according to the given differential equation?
-At the point (0,0), the slope is 0 because plugging in x=0 and y=0 into the equation y' = y - x yields y' = 0 - 0 = 0.
How does the slope field change when moving from the point (0,1) to (1,2)?
-The slope at (0,1) is calculated as 1 - 0 = 1, and at (1,2) it is 2 - 1 = 1. However, the visual representation changes from a slope of 1 to a steeper slope as the line segments become more vertical.
What is the significance of the points where the slope is zero in identifying the correct differential equation?
-The points where the slope is zero are particularly useful in identifying the correct differential equation because they indicate specific values of x and/or y where the rate of change is zero, which can be directly compared to the given equations.
How does the slope field change when x is equal to y?
-When x is equal to y, the slope according to the equation y' = y - x becomes 0, as the two terms cancel each other out. This results in horizontal lines in the slope field where x equals y.
What is the equation for the slope field that has zeros at x equals 0?
-The equation that has zeros at x equals 0 is one where the slope field shows horizontal lines at x=0, which could be option A, 3, 4, or 5 from the script, depending on the specific equation.
How can you identify the correct differential equation from the slope field?
-You can identify the correct differential equation by matching the graphical representation of the slope field with the given equations, particularly focusing on points where the slope is zero or where the slope field has specific characteristics that match the equation.
What additional resource is offered for those interested in more examples of slope fields and differential equations?
-The speaker offers their website as an additional resource, where viewers can find free access to over 400 calculus questions solved step-by-step, including more examples of slope fields and differential equations.
Outlines
📚 Introduction to Sketching Slope Fields
This paragraph introduces the concept of slope fields in the context of differential equations. The speaker explains the process of sketching out slope fields by calculating the derivatives at each point within a specified range, in this case from -2 to 2 for both x and y axes. The derivatives, represented by y' = dy/dx, are determined using the equation y' = y - x. The speaker illustrates how to plot these derivatives at various points, including at integer values and in between, by providing examples such as plotting at (0,0), (1,1), and (-1,-1). The process involves understanding the slope at each point, which can range from zero to positive or negative values, and sketching lines with the corresponding slopes. The speaker also mentions the importance of recognizing when the slope is zero, as this indicates a horizontal tangent to the solution curve.
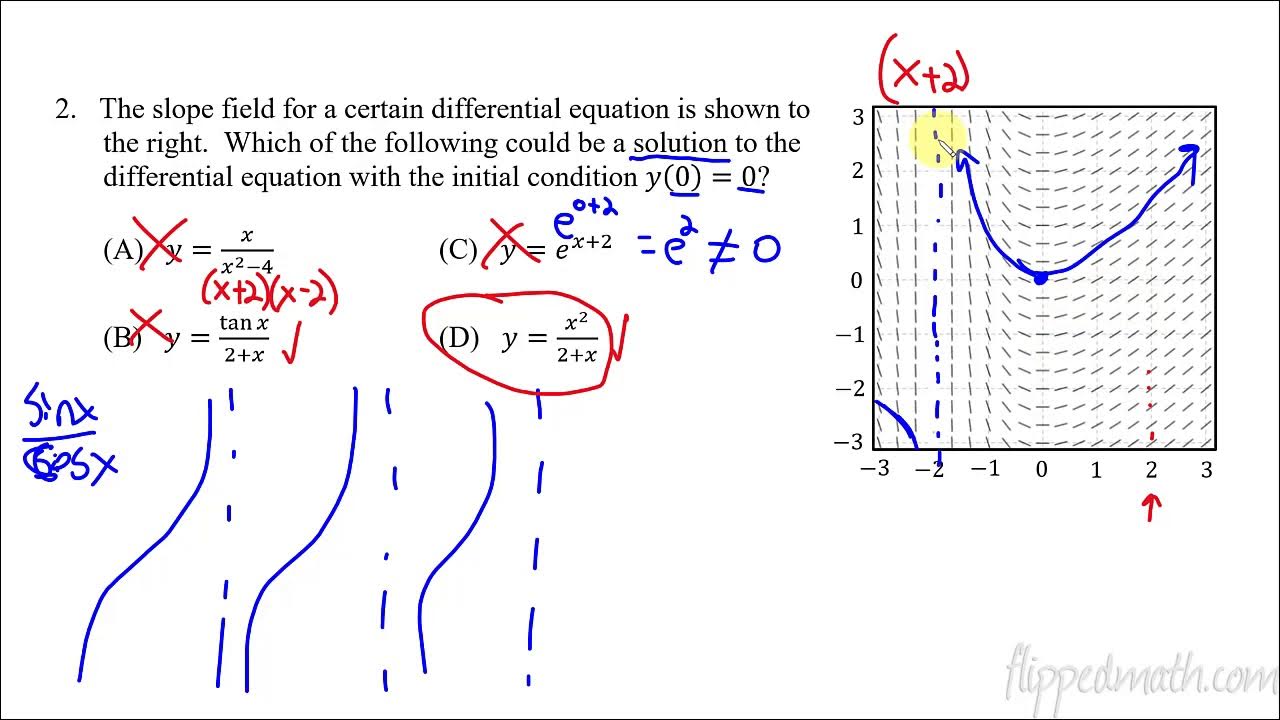
🔍 Matching Slope Fields to Differential Equations
In this paragraph, the speaker discusses the process of matching a given slope field to a specific differential equation. The focus is on identifying points where the slope is zero, as these are key to finding the correct match. The speaker provides a methodical approach to this task by first enlarging the graph for better visibility and then examining the slope field for areas where the derivatives are zero. The speaker identifies several potential matches based on this criterion and compares them to the provided differential equations. The goal is to find the equation that corresponds to the slope field where the slopes are zero at specific points, such as x equals 0 or y equals 0. The speaker concludes by suggesting that viewers can find more examples and step-by-step solutions on their website, offering a resource for further learning and practice.
Mindmap
Keywords
💡Slope Fields
💡Derivatives
💡Differential Equation
💡Slope
💡Tangent Line
💡Grid
💡Hash Marks
💡Zero Points
💡Matching
💡Graphical Analysis
Highlights
Introduction to the concept of slope fields in the context of sketching derivatives at each point.
Setting up the coordinate system from -2 to 2 for both x and y axes.
Explanation of plotting the slope (dy/dx) at specific points within a square grid.
Demonstration of plotting a slope of 0 at the origin (0,0) where y' = 0.
Illustration of plotting a slope of 1 at the point (1,0) using the equation y = x.
Visual representation of a slope of 2 and its graphical depiction.
Description of plotting negative slopes at points (0,-1) and (0,-2).
Process of determining slopes as x increases and becomes negative.
Identification of points where the slope is zero, specifically when x equals y.
Mistake correction and clarification on calculating slopes for points (1,-1) and (1,-2).
Graphical representation of the slope field for the differential equation y' = y - x.
Differentiation between slope fields based on the value of x and y, particularly at integer values.
Explanation of the slope field for the sine function, which is independent of x.
Identification of zero slopes at specific points and their significance in matching the differential equation.
Methodology for matching the graphical slope field with the given differential equations.
Use of zero slope points as a quick way to identify the correct differential equation.
Final matching of the slope fields to the correct differential equations based on the zero slope criteria.
Invitation to the speaker's website for more examples and step-by-step calculus solutions.
Transcripts
Browse More Related Video

Matching Slope Fields to Differential Equations Part 2
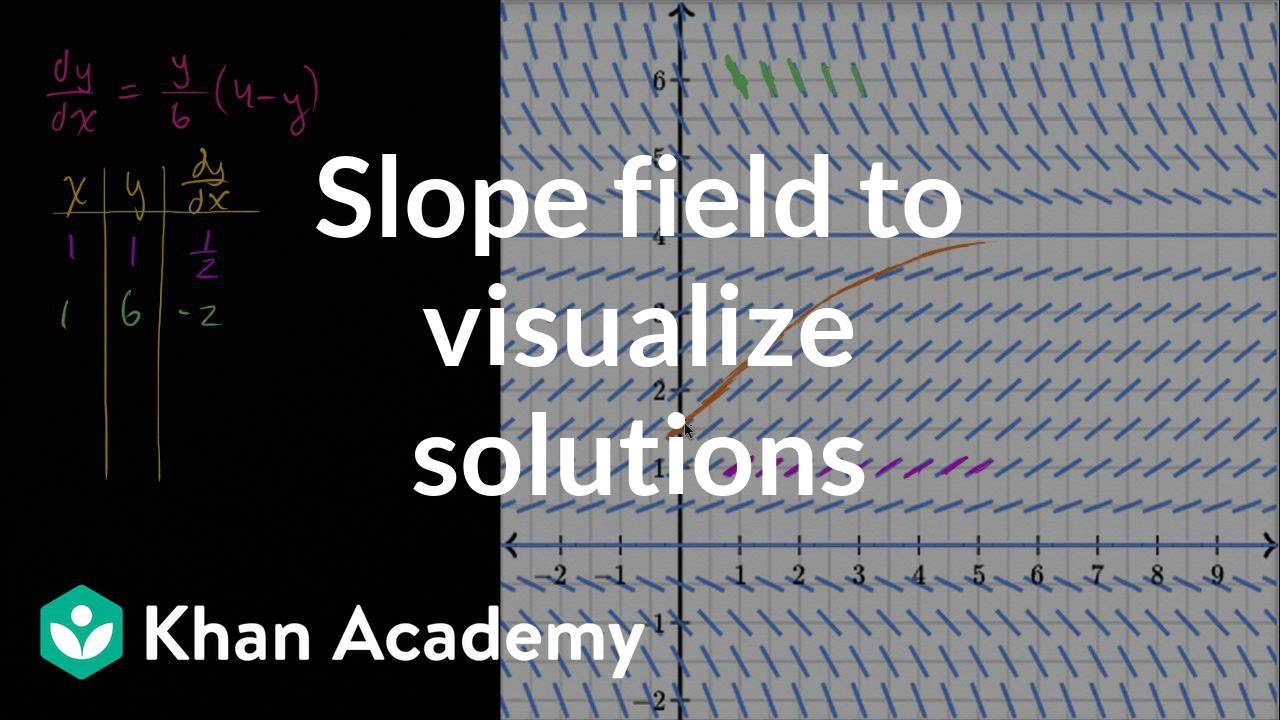
Slope field to visualize solutions | First order differential equations | Khan Academy
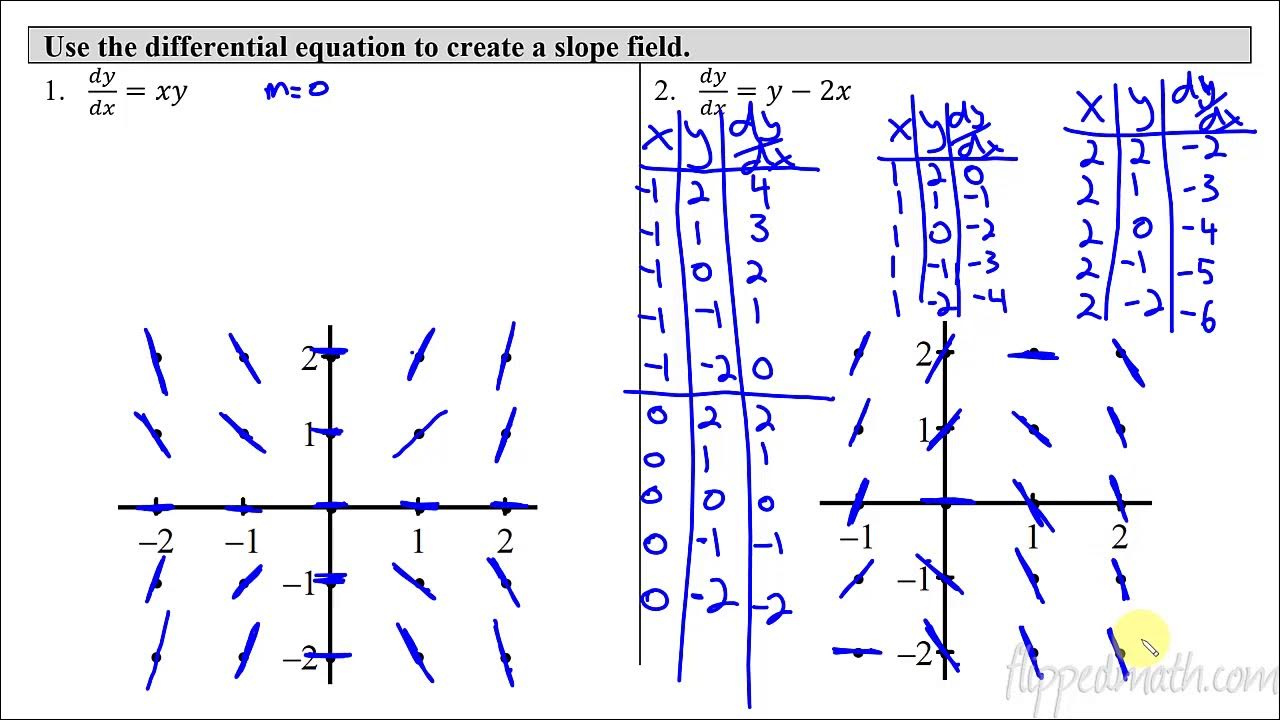
Calculus AB/BC – 7.3 Sketching Slope Fields
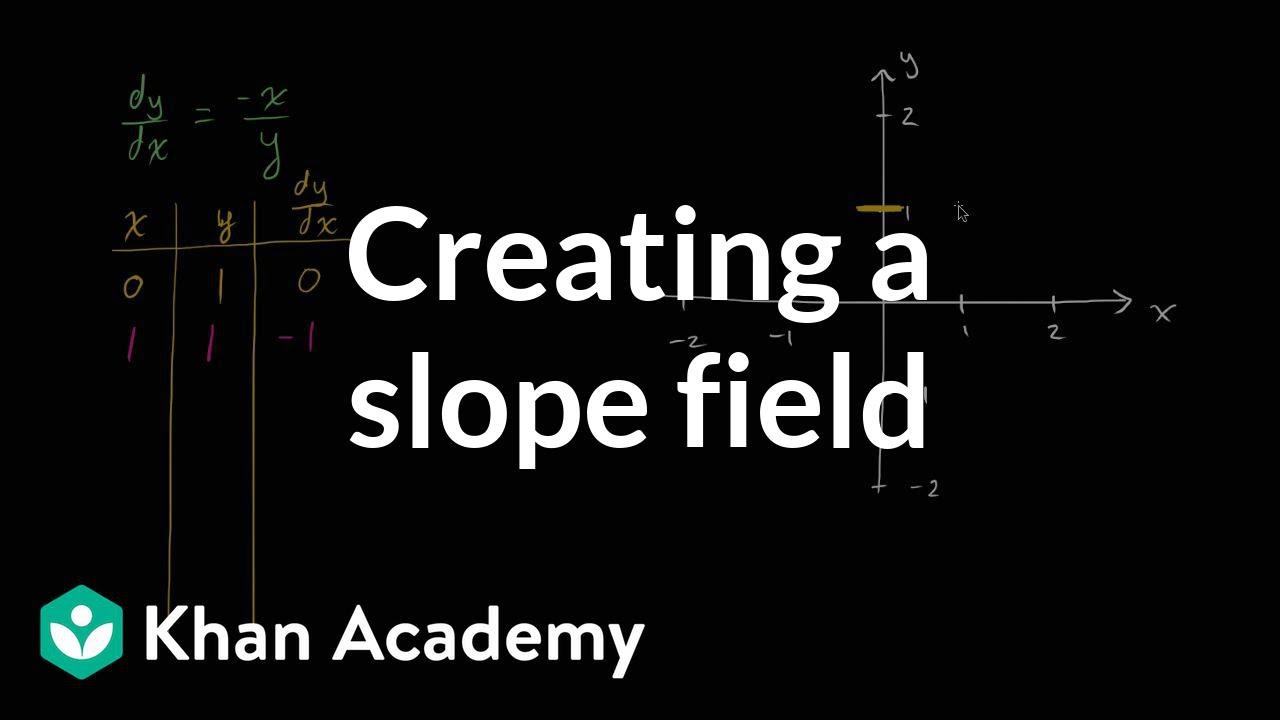
Creating a slope field | First order differential equations | Khan Academy
Slope Fields | Calculus
Calculus AB/BC – 7.4 Reasoning Using Slope Fields
5.0 / 5 (0 votes)
Thanks for rating: