Physics - Ch 66 Ch 4 Quantum Mechanics: Schrodinger Eqn (92 of 92) Modeling Polonium-212 Decay
TLDRThe video script explains the modeling of polonium-212 alpha decay by representing the potential barrier as small rectangular steps. By calculating the energy differences and transmission coefficients for each section, the script demonstrates how to determine the probability of an alpha particle breaking through the barrier. The process results in an approximate half-life that is significantly closer to the observed half-life than previous models, highlighting the accuracy of this method in modeling radioactive decay.
Takeaways
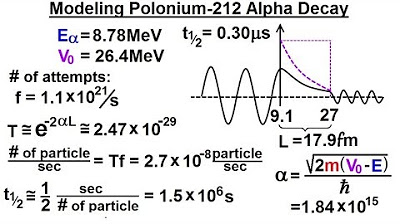
- 📊 The lecture focuses on modeling the alpha decay of Polonium-212, a highly unstable nucleus.
- 🧪 The potential barrier around the Polonium-212 nucleus is conceptualized as multiple small rectangular steps for easier analysis.
- 📐 The width of the potential barrier is 17.9 femtometers, and by dividing it into sections, each with a width of 3.55 femtometers, the analysis becomes more manageable.
- 🔢 The average potential height for each section is calculated, which is crucial for determining the energy difference between the alpha particle and the barrier.
- 💥 The alpha particle's ability to penetrate the barrier decreases as the energy difference increases, resulting in smaller alpha values and higher probabilities of breakthrough.
- 🧠 The transmission coefficient, or the probability of the alpha particle breaking through, is calculated for each section of the barrier and then multiplied together to find the total probability.
- 🕰️ The frequency of attempts and the probability of breakthrough are used to calculate the number of particles breaking through per second.
- 🎯 The calculated half-life of Polonium-212 based on this model is approximately 1.5 microseconds, which is significantly closer to the observed half-life of 0.3 microseconds than previous models.
- 🤔 The lecture highlights the remarkable nature of particle penetration through barriers, emphasizing the high number of attempts and the eventual success of alpha particles in breaking free from an unstable nucleus.
- 🚀 The process of breaking down complex decay processes into smaller, manageable sections provides a more accurate model of radioactive decay and the behavior of subatomic particles.
Q & A
What is the key concept being explained in the video?
-The video explains the process of correctly modeling the alpha decay of Polonium-212, particularly focusing on how an alpha particle attempts to break through the potential barrier of the unstable nucleus.
How is the potential barrier around the nucleus represented in the model?
-The potential barrier is modeled as a series of small rectangular steps, each with an average height determined by the energy difference between the particle and the barrier across that step.
What is the width of each section when the barrier is divided into five parts?
-When the barrier is divided into five sections, each section has a width of 3.55 femtometers.
How does the alpha value change as the energy difference between the particle and the barrier varies?
-The alpha value gets smaller as the energy difference between the particle and the barrier becomes smaller, which means a higher probability of the particle breaking through.
What is the total probability of a particle breaking through all five sections of the barrier?
-The total probability is calculated by multiplying the probabilities of breaking through each of the five sections together.
What is the number of particles per second that break through the barrier according to the model?
-The model indicates that approximately 3 million alpha particles per second will break through the barrier.
How is the average time between particle breakthroughs calculated?
-The average time is calculated by taking the inverse of the number of particles per second that break through, which gives the average time between particle breakthroughs.
What is the approximate calculated half-life of the decay?
-The approximate calculated half-life of the decay is around 1.5 microseconds.
How does the calculated half-life compare to the observed half-life?
-The calculated half-life is about 5 times larger than the observed half-life of 0.3 microseconds, showing a closer approximation than previous models.
What does the model suggest about the frequency of alpha particle attempts to break free from the nucleus?
-The model suggests that alpha particles attempt to break free from the nucleus very frequently, and despite the low probability of success per attempt, the sheer number of attempts leads to eventual breakthroughs.
How does dividing the barrier into smaller sections affect the modeling of alpha decay?
-Dividing the barrier into smaller sections allows for a more accurate modeling of alpha decay by accounting for the varying potential across the barrier, leading to a closer approximation of the observed half-life.
Outlines
🧪 Modeling Polonium-212 Alpha Decay
This paragraph explains the process of accurately modeling the alpha decay of Polonium-212. It discusses the unstable nucleus of Polonium-212 and the concept of an alpha particle attempting to overcome the potential barrier around the nucleus. The potential barrier is visualized as a series of small rectangular steps, each with an average potential height. The decay curve is used to represent the potential of the barrier, and the width and height of each section are calculated. The energy difference between the particle and the barrier is used to calculate the transmission coefficient, which is the probability of the particle breaking through. The paragraph details the calculation of the probability for each of the five sections of the barrier and how these probabilities are multiplied together to find the total probability of a particle breaking through all sections. It concludes with the calculation of the number of particles per second that break through and the determination of the half-life of the decay, comparing the calculated half-life to the observed half-life.
🤔 The Astonishing Persistence of Alpha Particles
This paragraph reflects on the remarkable nature of alpha particles attempting to break through the potential barrier of an unstable nucleus. It emphasizes the small probability of success per attempt but highlights the importance of the sheer number of attempts, which ultimately leads to the particle's escape. The speaker expresses amazement at the frequency with which particles attempt to break free from the nucleus and the physical dimensions and barriers they face. The paragraph concludes by reiterating the method used to calculate the frequency of particle escape, demonstrating the practical application of this knowledge in understanding radioactive decay processes.
Mindmap
Keywords
💡Polonium 212
💡Alpha Decay
💡Potential Barrier
💡Transmission Coefficient
💡Alpha Particle
💡Energy Difference
💡Probability
💡Half-Life
💡Quantum Tunneling
💡Frequency of Attempts
Highlights
The lecture explains the process of correctly modeling the alpha decay of Polonium 212.
Polonium 212 has an unstable nucleus, and an alpha particle attempts to escape through the potential barrier.
The potential barrier is modeled as a series of small rectangular steps.
The average height of each step is defined by the potential difference from left to right.
The decay curve represents the potential of the barrier from start to end.
The barrier has a width of 17.9 femtometers, which is 10 to the minus 15 meters.
By dividing the barrier into five sections, each section has a width of 3.55 femtometers.
The energy difference for each section is calculated to determine the transmission coefficient or probability of the particle breaking through.
The alpha value decreases as the energy difference between the particle and the barrier becomes smaller.
The probability of the particle breaking through each section is calculated.
The total probability of a particle breaking through all sections is found by multiplying the individual probabilities.
The number of particles per second that break through is calculated based on the probability and frequency of attempts.
The calculated half-life of the decay is approximately 1.5 microseconds.
The observed half-life is 0.3 microseconds, showing a close match to the calculated value.
The method provides a reasonably accurate model for the decay of Polonium 212 by dividing the barrier into small sections.
The average time between particles breaking through is calculated to be about three microseconds.
The process demonstrates the commonality of barrier penetration in various physical situations.
The frequency at which alpha particles attempt to break free from the nucleus is remarkable given the physical barrier.
The lecture provides a detailed explanation of how to calculate the half-life of Polonium 212 using the alpha decay model.
Transcripts
Browse More Related Video

Physics - Ch 66 Ch 4 Quantum Mechanics: Schrodinger Eqn (91 of 92) Modeling Polonium-212 Decay

Physics - Ch 66 Ch 4 Quantum Mechanics: Schrodinger Eqn (79 of 92) Simplified Transmission Coeff.

Half-Life and Radioactive Decay

Alpha Decay

Nuclear Half Life: Intro and Explanation

10. Radioactive Decay Continued
5.0 / 5 (0 votes)
Thanks for rating: