Scatter Plots and Lines of Best Fit By Hand
TLDRThe video script outlines a step-by-step process for manually constructing a scatterplot from a given table of points and determining the line of best fit without the use of a calculator. It emphasizes the importance of identifying and ignoring outliers to ensure a strong correlation among the data points. The script then illustrates how to select two points from the trendline to derive the equation of the line, explaining the calculation of the slope and y-intercept. The final equation is presented in two forms, y = x + 2, demonstrating a practical approach to linear regression and highlighting the consistency of the slope and y-intercept in approximating the trendline.
Takeaways
- 📊 The process begins with constructing a scatterplot from a table of points.
- 🎯 After plotting the points, the next step is to find the line of best fit by hand without using a calculator.
- 📝 Plotting involves placing each point on the coordinate plane according to its given coordinates.
- 🔍 Identifying outliers is crucial; they should be ignored as they do not follow the general trend of the data.
- 💪 A strong correlation in the data leads to a clearer line of best fit.
- 🤔 Approximation is key when finding the line of best fit by hand, as it won't be perfectly accurate.
- 🔢 The equation of a line is generally given by y = mx + b, where m is the slope and b is the y-intercept.
- 📌 To find the slope (m), use the formula (y2 - y1) / (x2 - x1) with two selected points from the scatterplot.
- 📝 Once the slope is determined, find the y-intercept (b) by substituting a point into the equation y = mx + b and solving for b.
- 📈 The final equation of the line of best fit can be written in slope-intercept form (y = mx + b) or point-slope form.
- 👀 Verify the equation by plugging in x values and checking if the corresponding y values match the plotted points.
Q & A
What is the primary focus of the video?
-The primary focus of the video is to demonstrate how to construct a scatterplot from a table of points and then find the line of best fit by hand without using a calculator.
How does the speaker begin the process of constructing the scatterplot?
-The speaker begins by plotting the given points on a coordinate plane, using the provided pair of numbers as coordinates for each point.
What is the significance of identifying outliers in the data set?
-Identifying outliers is important because they do not follow the general trend of the data and can skew the line of best fit. In such cases, outliers should be ignored to obtain a more accurate representation of the data's trend.
How does the speaker approximate the line of best fit?
-The speaker approximates the line of best fit by visually estimating a line that roughly goes through the middle of the plotted points, representing the strongest correlation within the data set.
What are the two key components needed to write the equation of a line?
-The two key components needed to write the equation of a line are the slope (M) and the y-intercept (B).
How does the speaker choose the two points for finding the equation of the line?
-The speaker chooses two points that seem reasonable and lie approximately on the visually estimated trend line. The choice can vary, but the goal is to pick points that best represent the overall trend without outliers.
What formula does the speaker use to calculate the slope of the line?
-The speaker uses the slope formula (y2 - y1) / (x2 - x1), employing the values from the two selected points to calculate the slope.
How is the y-intercept (B) determined in the process?
-The y-intercept (B) is determined by plugging one of the selected points into the equation y = mx + b and solving for B when y and x values are known.
What is the final equation of the line of best fit derived in the video?
-The final equation of the line of best fit derived in the video is y = x + 2.
How does the speaker verify the approximated line of best fit?
-The speaker verifies the approximated line of best fit by checking if the slope consistently goes up by 1 for every increase in x by 1, and if the y-intercept is approximately 2 when the x value is 0.
What is the main limitation of finding the line of best fit by hand?
-The main limitation of finding the line of best fit by hand is that it cannot provide an exact or highly precise answer; it is an approximation that gives a reasonable solution without the use of a calculator.
Outlines
📊 Constructing a Scatterplot and Finding the Line of Best Fit
This paragraph explains the process of constructing a scatterplot from a table of points and finding the line of best fit without using a calculator. It begins with plotting the given points on a coordinate plane and then visually approximating a line that goes through the middle of these points to represent the best fit. The speaker acknowledges that this method is an approximation and may not be perfectly accurate. However, it serves the purpose of illustrating the concept and allows the selection of two points to determine the equation of the line. The points chosen are (7, 9) and (3, 5), and using these points, the speaker calculates the slope (M) and y-intercept (B) of the line. The slope is found by using the formula (y2 - y1) / (x2 - x1) and results in a value of 1. To find the y-intercept, one of the points is substituted into the equation y = mx + b, solving for b gives a value of 2. The final equation of the line of best fit is therefore y = x + 2, which is a simple linear equation reflecting a strong correlation between the points.
🔢 Using the Equation to Find a Specific Value
This paragraph focuses on applying the previously derived line equation to find the value of y when x is 9. The speaker reiterates the equation y = x + 2 and demonstrates how to plug in the x value to calculate the corresponding y value. By substituting x with 9 into the equation, the speaker calculates the y value to be 11, which is a reasonable approximation as it aligns with the trend observed in the scatterplot. The speaker emphasizes that this method is done by hand and is an approximation; more accurate results will be achieved using a calculator in future lessons. This paragraph reinforces the practical application of the line equation and the importance of understanding how to use it to make predictions or find specific values based on the established relationship between variables.
Mindmap
Keywords
💡Scatterplot
💡Line of Best Fit
💡Outlier
💡Correlation
💡Trend Line
💡Slope
💡Y-Intercept
💡Equation of a Line
💡Algebra
💡Calculator
💡Estimation
Highlights
The process of constructing a scatterplot from a table of points is discussed.
A method for finding the line of best fit without using a calculator is presented.
The importance of plotting points accurately on the coordinate plane is emphasized.
The concept of outliers and their impact on the line of best fit is introduced.
The strong correlation in the data leads to a clear line of best fit.
The selection of two points from the trendline to find the line's equation is explained.
The equation of a line (y = mx + b) is reviewed, where m is the slope and b is the y-intercept.
The calculation of the slope using the formula (y2 - y1) / (x2 - x1) is demonstrated.
The method for finding the y-intercept (b) by substituting a point into the equation is shown.
The final equation of the line of best fit is determined to be y = x + 2.
The practical application of the line's equation is illustrated by finding the y-value for a given x-value.
The approximation of the line by hand is acknowledged to have limitations.
The use of a calculator for more precise results is mentioned as a topic for future lessons.
The consistency of the slope in the context of the scatterplot is observed.
The approximate nature of the y-intercept is discussed in relation to the graph.
The process of finding the line of best fit is presented as a valuable tool for understanding data relationships.
Transcripts
Browse More Related Video
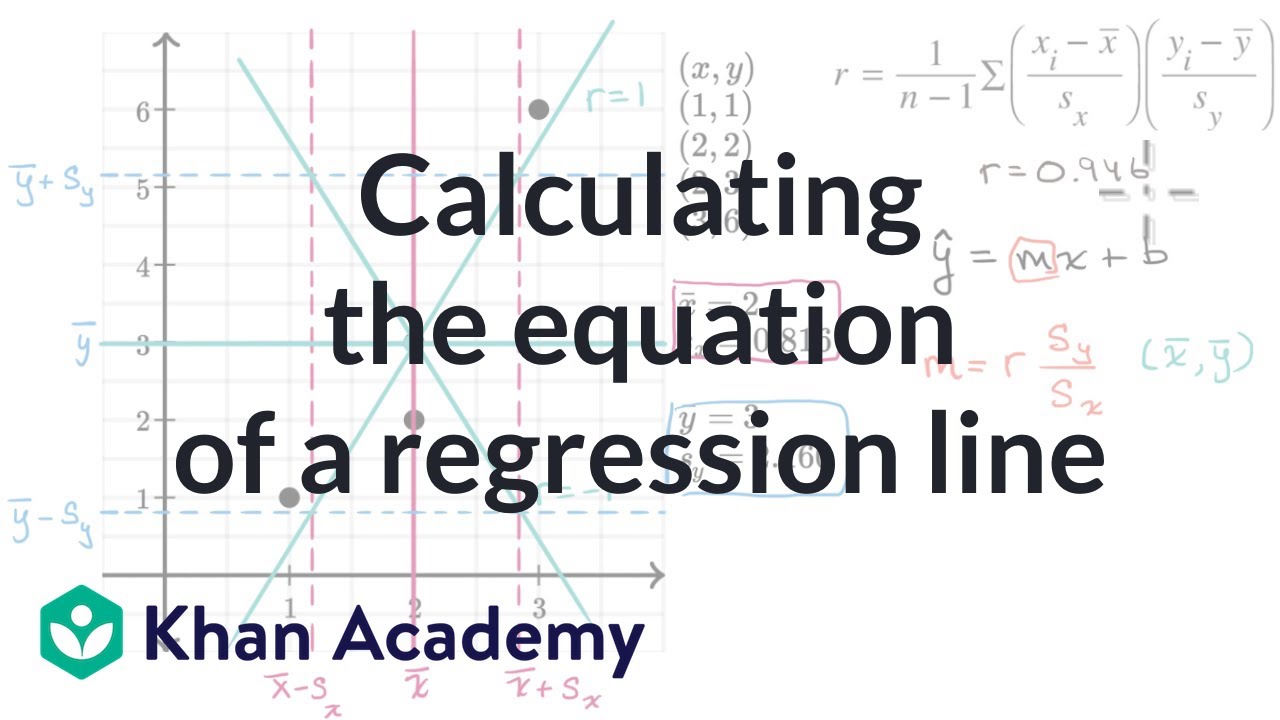
Calculating the equation of a regression line | AP Statistics | Khan Academy

Interpreting Graphs in Chemistry
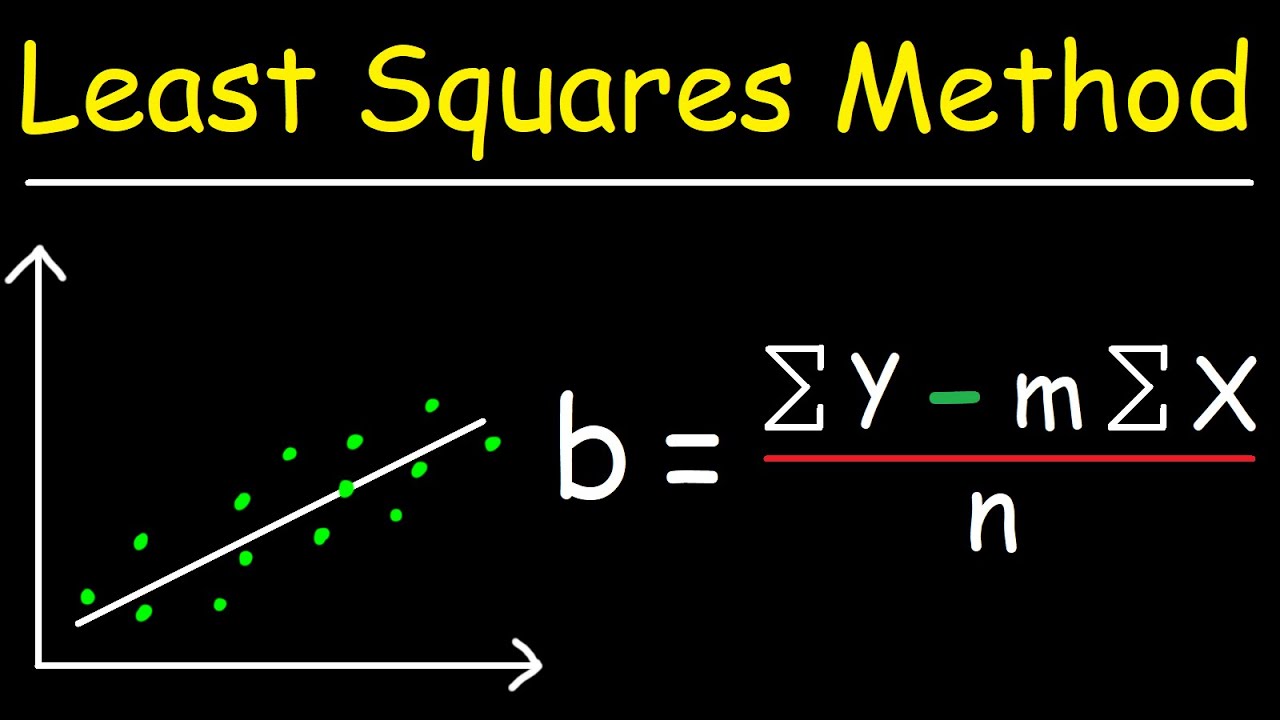
Linear Regression Using Least Squares Method - Line of Best Fit Equation
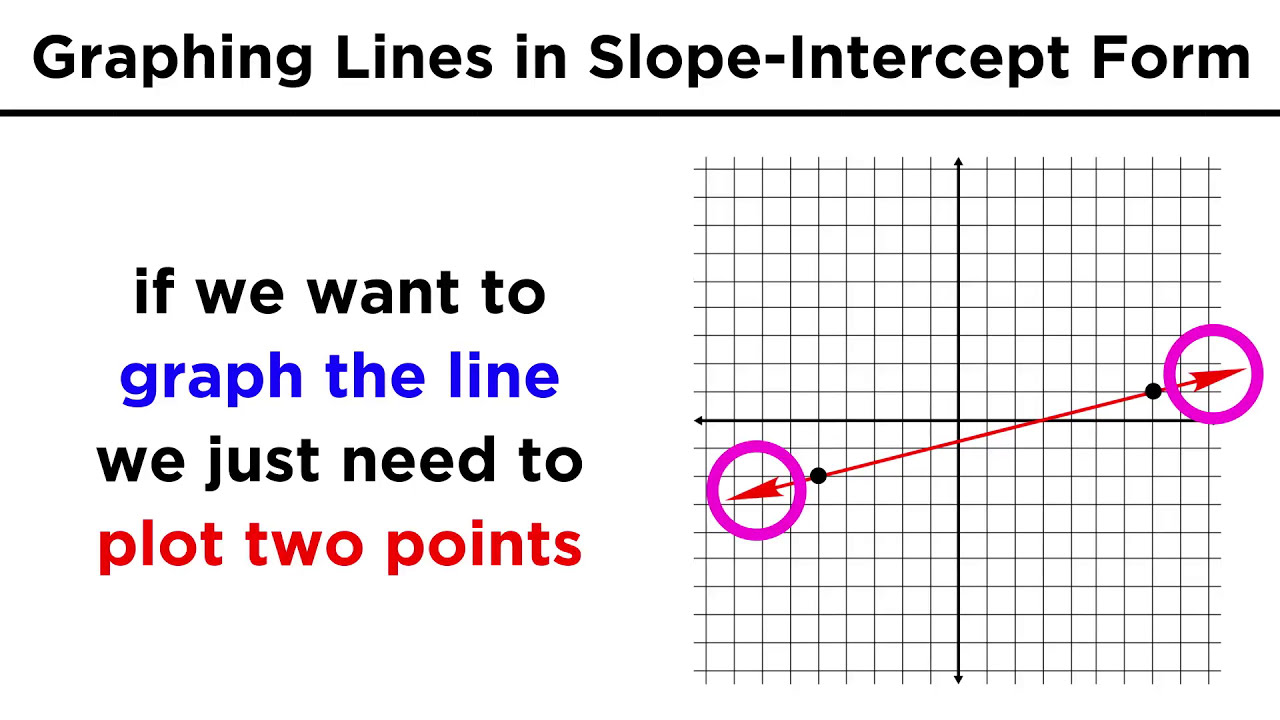
Graphing Lines in Slope-Intercept Form (y = mx + b)

Regression and R-Squared (2.2)
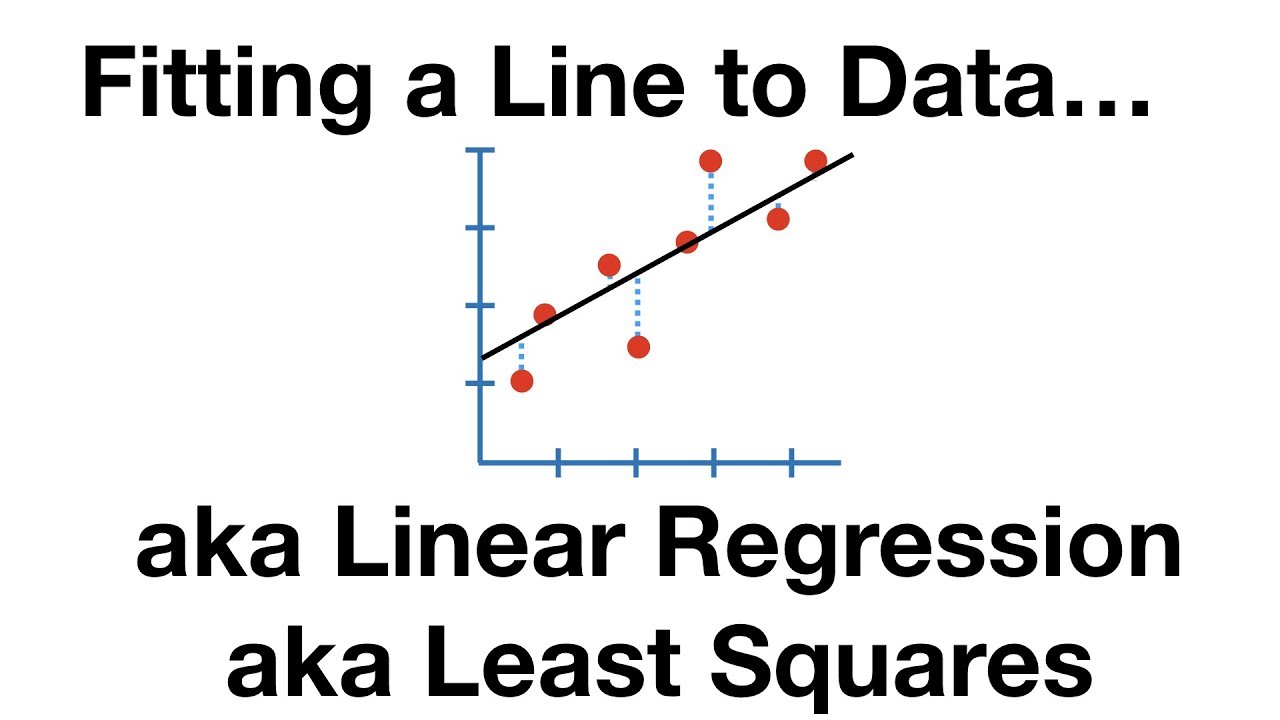
The Main Ideas of Fitting a Line to Data (The Main Ideas of Least Squares and Linear Regression.)
5.0 / 5 (0 votes)
Thanks for rating: