Mean Absolute Deviation
TLDRIn this video, Jeff Jacobson explains the concept of mean absolute deviation (MAD) in statistics. He breaks down the terms 'mean' and 'deviation' and illustrates how to calculate MAD using examples. Jeff demonstrates finding the mean, creating dot plots, and calculating the distances of data points from the mean to find the average deviation. He uses real-life examples of baseball pitchers Tim Lincecum and Felix Hernandez to show how MAD helps in comparing their performance consistency. The video concludes with an exercise for viewers to practice on their own.
Takeaways
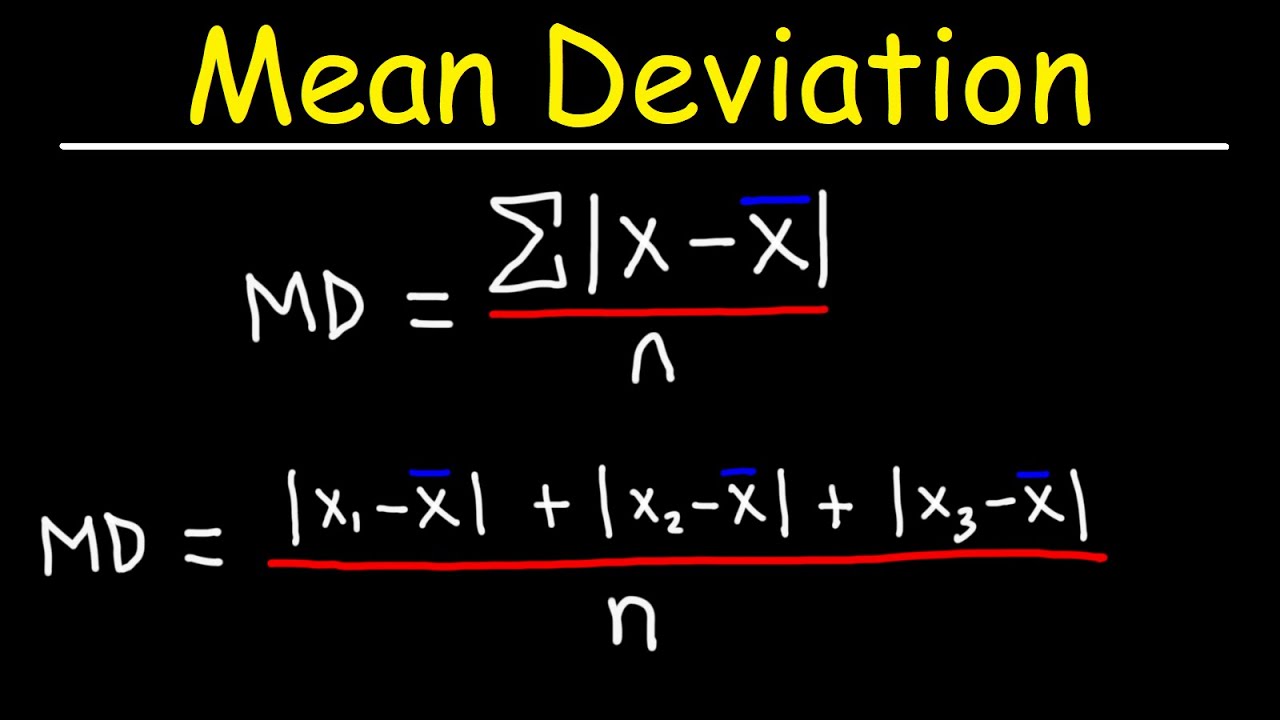
- 😀 The mean absolute deviation (MAD) is the average distance of data values from the mean.
- 📊 To find the MAD, start by calculating the mean of the data set.
- ✏️ Step two involves creating a dot plot of the data values.
- 📐 Replace each data value in the dot plot with its distance from the mean.
- ➕ Sum these distances and divide by the number of data values to find the MAD.
- 🧮 Example: For a data set with values 6, 7, 12, 19, 5, the MAD is 1.25.
- ⚾ Using real data, calculate the mean, median, and MAD for sports statistics.
- 🔍 The MAD helps assess consistency in data, such as a pitcher's performance.
- 🏅 Felix Hernandez's lower MAD indicates more consistent pitching compared to Tim Lincecum.
- 📈 The mean and median alone cannot always differentiate data; the MAD provides additional insights.
Q & A
What is the main topic of the video?
-The main topic of the video is the mean absolute deviation, which is a measure of variability in a set of data.
What is the first step in finding the mean absolute deviation?
-The first step in finding the mean absolute deviation is to calculate the mean (average) of the data set.
What is the meaning of 'deviation' in the context of mean absolute deviation?
-'Deviation' in the context of mean absolute deviation refers to the departure of data values from the mean, similar to how one might deviate from a normal course of action.
How is the mean calculated in the example provided?
-In the example, the mean is calculated by summing the numbers 6, 7, 12, 19, 24, and 5, and then dividing by the total count of these numbers, which is 8.
What is the purpose of drawing a dot plot in the process of finding the mean absolute deviation?
-Drawing a dot plot helps visualize the data and understand how far each data point is from the mean, which is crucial for calculating the mean absolute deviation.
What is the difference between the first and second dot plots in the example?
-The first dot plot is a normal representation of the data, while the second dot plot shows the absolute distance of each data point from the mean, which is essential for calculating the mean absolute deviation.
How is the mean absolute deviation calculated in the example?
-The mean absolute deviation is calculated by summing the absolute distances of each data point from the mean and then dividing by the total number of data points.
What does a mean absolute deviation of 1.25 indicate about the data set in the example?
-A mean absolute deviation of 1.25 indicates that, on average, the data values are 1.25 units away from the mean.
How does the mean absolute deviation help in comparing the consistency of pitchers in the example with Tim Lincecum and Felix Rodriguez?
-The mean absolute deviation helps in comparing the consistency of pitchers by showing how closely the number of runs allowed in each game deviates from the mean, indicating the level of consistency.
What conclusion can be drawn from the mean absolute deviation when comparing Tim Lincecum and Felix Rodriguez?
-A lower mean absolute deviation indicates greater consistency. In the example, Felix Rodriguez has a lower mean absolute deviation than Tim Lincecum, suggesting that Rodriguez is more consistent.
Outlines
📊 Introduction to Mean Absolute Deviation (MAD)
In this introductory section, Jeff Jacobson welcomes viewers to a lesson on Mean Absolute Deviation (MAD). He explains the concept of deviation using relatable examples, such as a car deviating from its path. The mean absolute deviation is defined as the average of how much data values differ from the mean. The explanation sets the stage for a step-by-step approach to calculating MAD with a focus on understanding the terms 'mean', 'absolute', and 'deviation'.
🧮 Example Calculation of MAD
The first example involves calculating the MAD of a data set. Jeff demonstrates finding the mean of the data set, then constructing a dot plot to visualize the data points. He explains how to determine the distance of each data point from the mean, treating all distances as positive values (absolute values). He then sums these distances and divides by the number of data points to find the MAD. The resulting MAD is interpreted as the average distance of data points from the mean.
⚾ MAD for Baseball Pitchers
In this section, Jeff compares the performance consistency of two baseball pitchers, Tim Lincecum and Felix Hernandez, using MAD. For each pitcher, he calculates the mean, median, and MAD of the number of runs allowed in 10 games. By comparing these values, he illustrates how MAD can show consistency, with a lower MAD indicating more consistent performance. The example reinforces the utility of MAD in real-world scenarios, such as sports analytics.
🤔 Interpretation and Conclusion
Jeff concludes by discussing the significance of using MAD to distinguish between the data sets of the two pitchers. He highlights that while the mean and median were the same for both, the MAD revealed differences in consistency. Felix Hernandez had a lower MAD, indicating he was more consistent in the number of runs allowed per game compared to Tim Lincecum. Jeff encourages viewers to apply these concepts and subscribe for more educational content.
Mindmap
Keywords
💡Mean
💡Deviation
💡Mean Absolute Deviation (MAD)
💡Absolute Value
💡Dot Plot
💡Consistency
💡Median
💡Tim Lincecum
💡Felix Hernandez
💡Runs Allowed
Highlights
Introduction to mean absolute deviation (MAD).
Explanation of the term 'deviation' and its relevance.
Definition of mean absolute deviation as the average of how much data values differ from the mean.
Step-by-step process to find the mean absolute deviation: starting with finding the mean.
Example data set provided to calculate MAD.
Construction of a dot plot to visualize data values.
Calculation of distances of data points from the mean.
Summation of distances and dividing by the number of values to find MAD.
Interpretation of MAD result (1.25) in the context of data values.
Second example using data from Tim Lincecum's games to find mean, median, and MAD.
Calculation of mean (3.5) and median (4) for Tim Lincecum's data.
Calculation of MAD (2.4) for Tim Lincecum's data.
Comparison with another pitcher, Felix Hernandez, using the same method.
Calculation of mean, median, and MAD (1.4) for Felix Hernandez's data.
Conclusion: Felix Hernandez is more consistent than Tim Lincecum based on MAD values.
Transcripts
Browse More Related Video

What is Standard Deviation and Mean Absolute Deviation | Math, Statistics for data science, ML
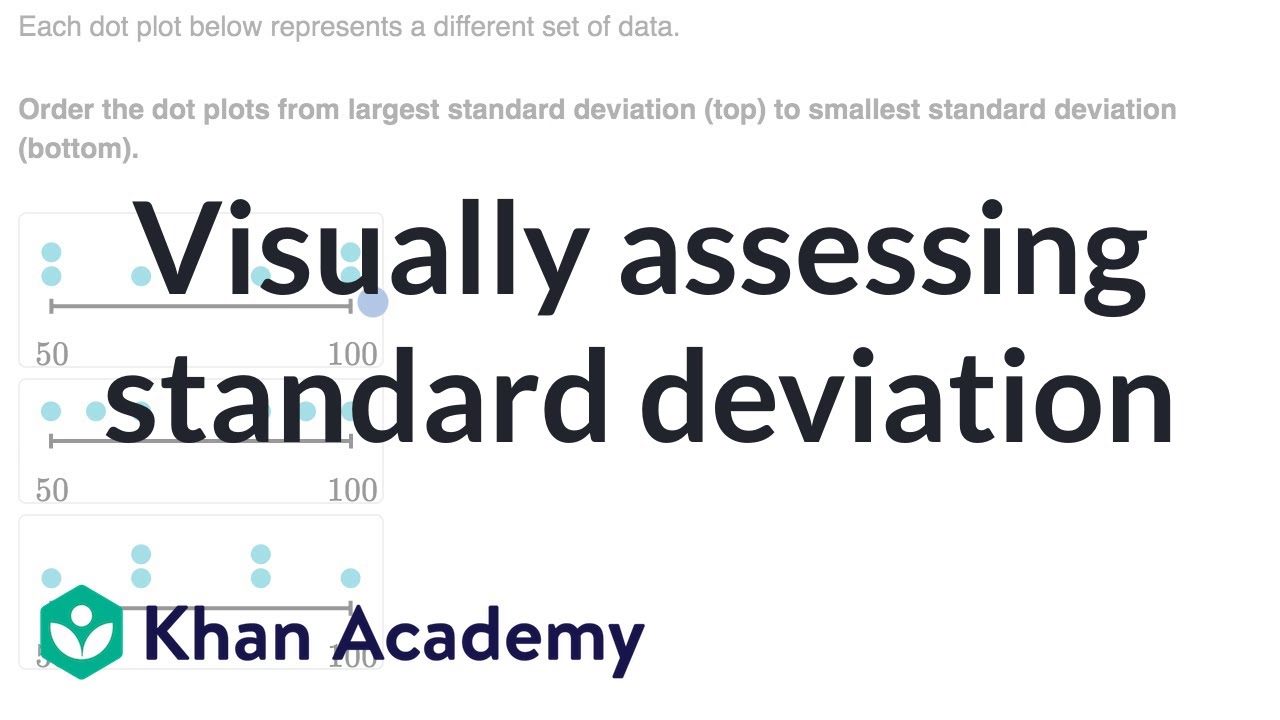
Visually assessing standard deviation | AP Statistics | Khan Academy

Standard Deviation & Mean Absolute Deviation Explained - 6-8-19]
Mean Absolute Deviation - Statistics

Standard Deviation and Variance
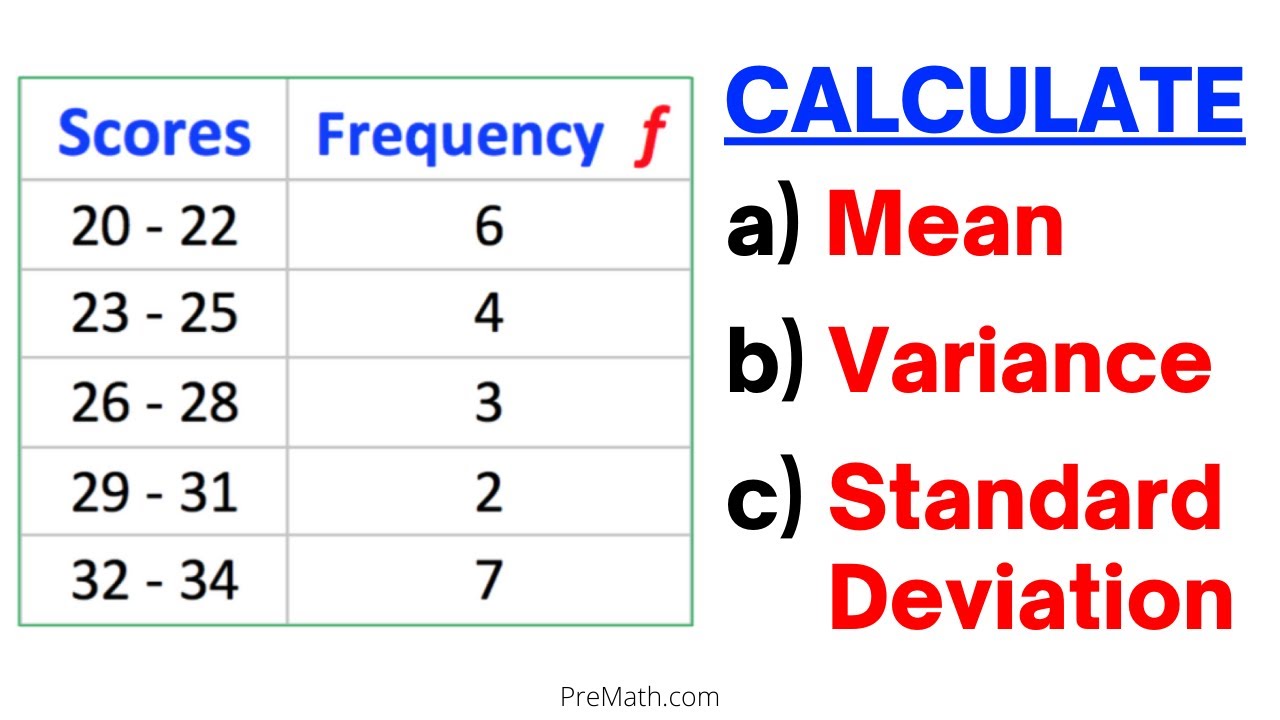
Can You Find Mean, Variance, & Standard Deviation of a Frequency Grouped DataTable? Simple Tutorial
5.0 / 5 (0 votes)
Thanks for rating: