Calculus gr 12 Exam Questions
TLDRIn this video, the speaker addresses a common challenge faced by Grade 12 students: understanding questions related to the first derivative of a graph. The explanation focuses on the relationship between the first derivative and the original graph's gradient. The speaker walks through examples to clarify concepts such as turning points, increasing and decreasing intervals, and the interpretation of graph values. The goal is to demystify a topic that many students find confusing, making it more approachable and easier to understand.
Takeaways
- 📝 Many Grade 12 learners struggle with understanding questions related to graph interpretation, especially those involving derivatives.
- 📈 The first derivative of a graph represents the gradient of the original graph.
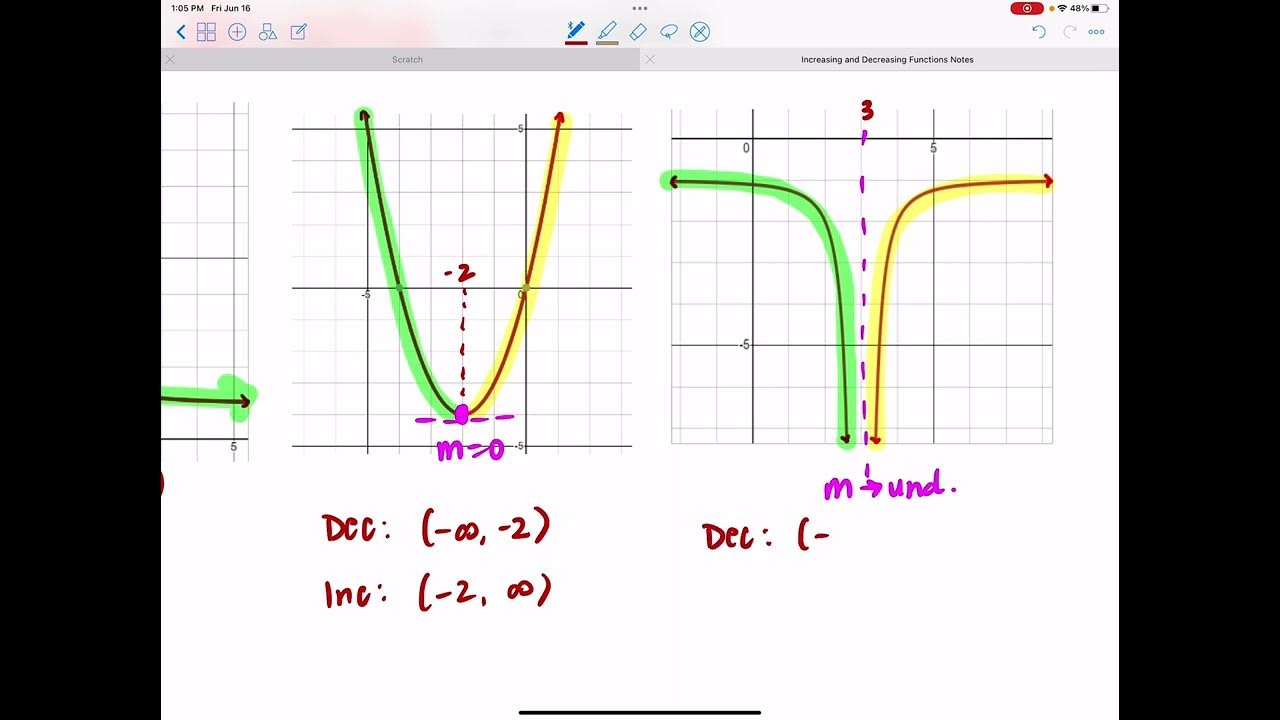
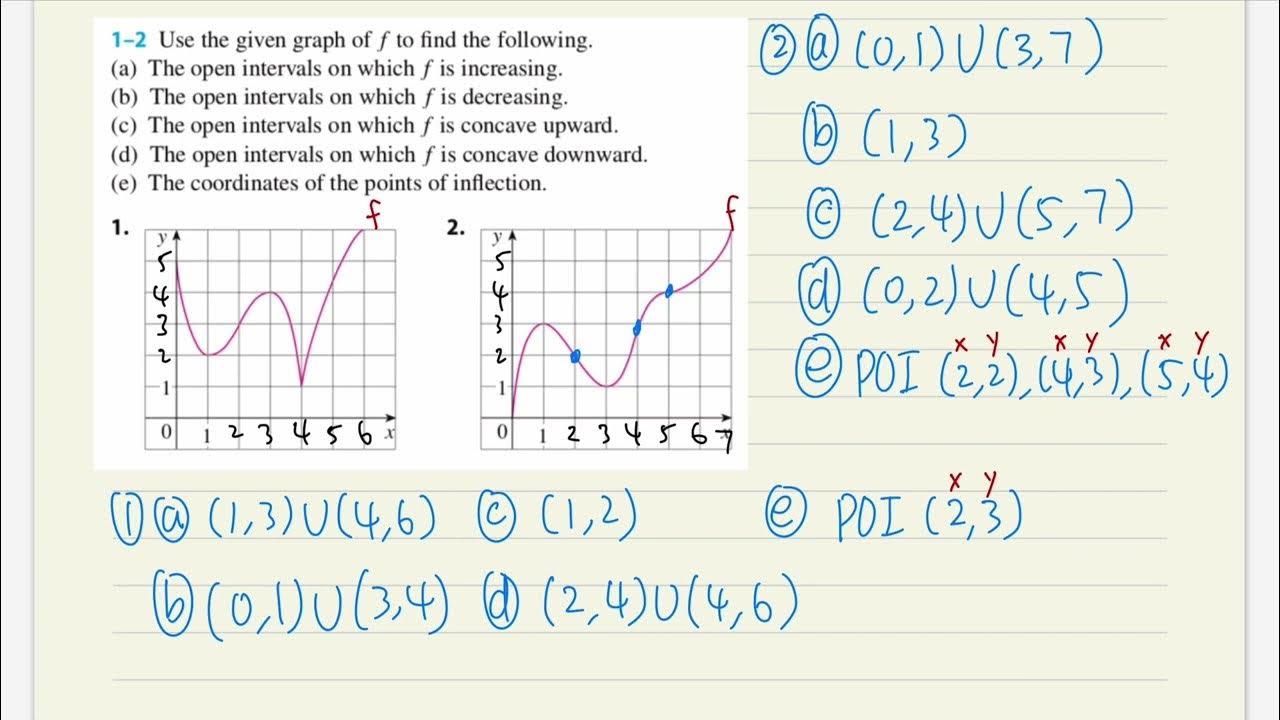
- 🔢 A point on the first derivative graph with a y-value of zero indicates a turning point on the original graph.
- 🎯 When asked where the original graph is increasing, look for where the first derivative graph's y-values are positive.
- 🔍 Similarly, when asked where the original graph is decreasing, identify where the first derivative graph's y-values are negative.
- ❓ The concept of turning points on the original graph can be confusing when only the first derivative graph is provided.
- 🟢 Increasing regions on the original graph correspond to positive y-values on the first derivative graph.
- 🔴 Decreasing regions on the original graph correspond to negative y-values on the first derivative graph.
- 📚 Understanding how to interpret the first derivative graph is crucial for solving these types of questions in exams.
- 🧠 The speaker emphasizes that this knowledge can make these questions either very easy or very difficult, depending on the student's understanding.
Q & A
Why do many students struggle with questions involving the first derivative?
-Many students struggle with first derivative questions because they find it confusing to understand how the first derivative relates to the original graph. The concept of using the derivative's graph to determine the behavior of the original function can be difficult to grasp.
What is the first derivative a representation of in terms of a graph?
-The first derivative represents the gradient or slope of the original graph. The y-values on the derivative graph indicate the rate of change (gradient) of the original function at various points.
How can you identify the turning points of the original graph using the first derivative graph?
-The turning points of the original graph occur where the first derivative is equal to zero. On the first derivative graph, these are the points where the y-values are zero.
What does it mean when the first derivative is positive?
-When the first derivative is positive, it means the gradient of the original graph is positive, indicating that the original function is increasing at those points.
How do you determine where the original function is increasing using the first derivative graph?
-To determine where the original function is increasing, look for the intervals on the first derivative graph where the y-values are positive. These intervals correspond to where the original function has a positive gradient and is increasing.
What does it mean when the first derivative is negative?
-When the first derivative is negative, it means the gradient of the original graph is negative, indicating that the original function is decreasing at those points.
How can you determine where the original function is decreasing using the first derivative graph?
-To determine where the original function is decreasing, look for the intervals on the first derivative graph where the y-values are negative. These intervals correspond to where the original function has a negative gradient and is decreasing.
How do you find the gradient of a tangent to the original graph at a specific point using the first derivative graph?
-To find the gradient of the tangent to the original graph at a specific x-value, locate that x-value on the first derivative graph and check the corresponding y-value. This y-value represents the gradient of the tangent at that point.
What is the significance of finding the x-values where the first derivative is zero?
-Finding the x-values where the first derivative is zero is significant because these points correspond to the turning points of the original graph, where the function changes direction from increasing to decreasing or vice versa.
Why might questions about the first derivative appear difficult or easy in exams?
-Questions about the first derivative might appear difficult or easy depending on the student's understanding of how the derivative relates to the original function. For those who understand the relationship, these questions are straightforward; for others, they can be confusing and result in lost marks.
Outlines
🧠 Understanding the First Derivative
The speaker emphasizes the importance of understanding questions related to the first derivative, which many students struggle with. Using a graph as an example, the speaker explains that the first derivative represents the gradient of the original graph. Points on the first derivative graph where the y-value is zero indicate turning points on the original graph, as the gradient there is zero. The speaker clarifies common misconceptions about identifying turning points and stresses the significance of recognizing these points correctly.
📈 Identifying Increasing and Decreasing Intervals
The speaker discusses how to determine where the original graph is increasing or decreasing based on the first derivative graph. When the first derivative is positive, the original graph is increasing; when it is negative, the original graph is decreasing. The speaker guides the viewers through the process of identifying these intervals on the first derivative graph and explains the relevance of these concepts in exams, noting that while such questions may not always appear, they are straightforward if understood properly.
🔍 Analyzing Gradients and Turning Points
The speaker walks through a sample exam question, explaining how to determine the gradient of the tangent and the turning points of the original graph using the first derivative graph. They clarify that the y-values of the first derivative graph represent the gradient of the original graph. By identifying where the y-values are zero, the speaker shows how to find the x-coordinates of the turning points on the original graph. The explanation concludes with a discussion on how to determine where the graph is decreasing based on negative y-values in the first derivative graph.
Mindmap
Keywords
💡First Derivative
💡Gradient
💡Turning Point
💡Increasing Function
💡Decreasing Function
💡X-values
💡Y-values
💡Cubic Graph
💡Tangent
💡Negative Gradient
Highlights
Introduction to a common area of struggle for Grade 12 learners, particularly with questions involving the first derivative.
Explanation that the first derivative represents the gradient of the original graph.
Clarification that points on the first derivative graph with a y-value of zero correspond to turning points on the original graph.
Discussion on how to determine where the original graph is increasing based on where the first derivative is positive.
Emphasis on the importance of understanding the relationship between the first derivative and the original graph to avoid common mistakes.
Explanation that decreasing intervals on the original graph correspond to where the first derivative is negative.
Practical advice on identifying where the original graph is increasing or decreasing by analyzing the first derivative graph.
Reassurance that mastering this concept can turn a potentially challenging question into an easy one in exams.
Detailed walkthrough of a question involving the first derivative and the original graph's turning points.
Illustration of how to find the gradient of the tangent to the original graph using the first derivative graph.
Explanation that the turning points of the original graph occur where the first derivative equals zero.
Identification of turning points on the original graph based on where the y-values of the first derivative graph are zero.
Discussion on determining the intervals where the original graph is decreasing by analyzing the first derivative graph.
Emphasis on the importance of understanding the graphical representation of the first derivative to solve these types of questions.
Final reminder that understanding the first derivative's role is key to solving these types of exam questions effectively.
Transcripts
Browse More Related Video

Increasing and Decreasing Functions

Where is the function increasing, decreasing, concave up, concave down, and points of inflection?

Calculus AB Homework 4.6: Relationship between f, f', and f''

Finding Stationary Points and Determining their Nature

Draw Cubic Graph Grade 12

AP Calculus AB: Lesson 2.4 The Second Derivative
5.0 / 5 (0 votes)
Thanks for rating: