Find T Score(T Value) from T Table for Confidence Interval
TLDRThe video script provides a tutorial on using a T-score table to calculate confidence intervals in statistical analysis. It explains the concept of degrees of freedom (DF), derived from the sample size minus one, and demonstrates how to locate the appropriate T-value for different confidence levels, such as 99% and 98%. The script also mentions a downloadable PDF table and concludes with a reminder about z-scores for various confidence levels, emphasizing the importance of using the correct table for accurate results.
Takeaways
- 📚 The video is a tutorial on using a T-score table for confidence intervals in statistical analysis.
- 🔍 The T-score table can vary, but the video aims to teach viewers how to use any table to find T values.
- 📈 A link to a downloadable PDF T-score table is provided for the viewers' convenience.
- 🔢 Degrees of freedom (DF) is a crucial concept, calculated as the sample size minus one.
- 🎯 To find the T value, locate the degrees of freedom on the left side of the table and match it with the desired confidence level.
- 🌐 For a 99% confidence level, if the degrees of freedom is 30, the T value is 2.75 according to the example provided.
- 📉 For a different confidence level, such as 98%, the process involves finding the corresponding line and intersection on the table to get the T score.
- 🔑 The T score for a 98% confidence level with 10 degrees of freedom is given as 2.81 in the example.
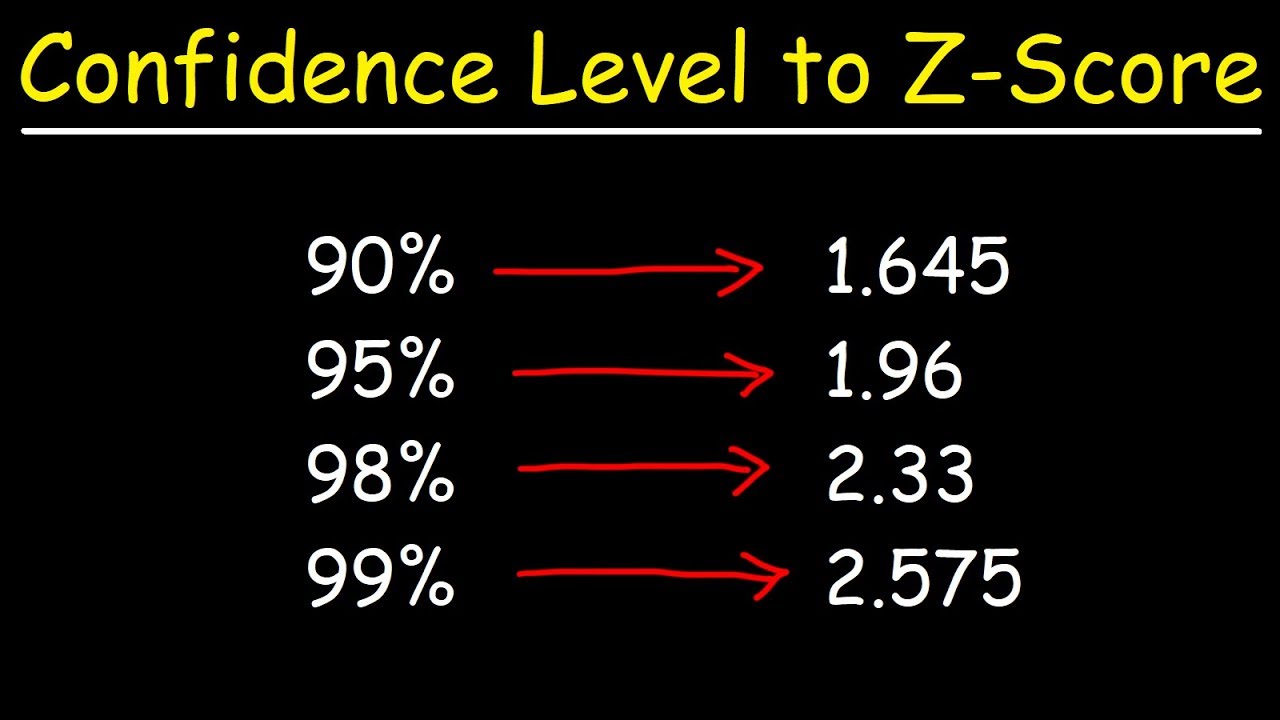
- 📊 The table also includes z-scores for different confidence levels, which can be used as a reference.
- 📝 The table provides z-scores for common confidence levels like 90%, 95%, and 99%.
- 👍 The video concludes with a reminder that the table is a helpful tool for finding the necessary statistical values.
Q & A
What is the purpose of the 'score table' mentioned in the transcript?
-The 'score table' is used to find the T value for a confidence interval problem in statistical analysis.
Why might someone use a different table than the one provided in the video?
-One might use a different table if they have their own preferred or more accessible table, but the video aims to teach how to use any T table for finding the T value.
What does DF stand for in the context of the transcript?
-DF stands for 'degrees of freedom', which is a statistical term used in the context of hypothesis testing.
How is the degrees of freedom calculated in a sample?
-The degrees of freedom is calculated as the sample size minus one (DF = sample size - 1).
If there are 31 samples, what would be the degrees of freedom?
-With 31 samples, the degrees of freedom would be 30 (31 - 1).
What is the significance of finding the correct degrees of freedom in the T table?
-Locating the correct degrees of freedom is crucial for accurately determining the T value corresponding to a specific confidence level.
What is a 99% confidence level and how does it relate to finding the T value?
-A 99% confidence level indicates a high degree of certainty in the results of a statistical test. It is used to find the T value that corresponds to this level of confidence in the T table.
In the transcript, what T value corresponds to a 99% confidence level with 30 degrees of freedom?
-For a 99% confidence level with 30 degrees of freedom, the T value is 2.75 according to the table provided.
What is the difference between a T score and a Z score?
-A T score is used in T-tests with smaller sample sizes and varies with degrees of freedom, while a Z score is used for larger sample sizes and is more standardized.
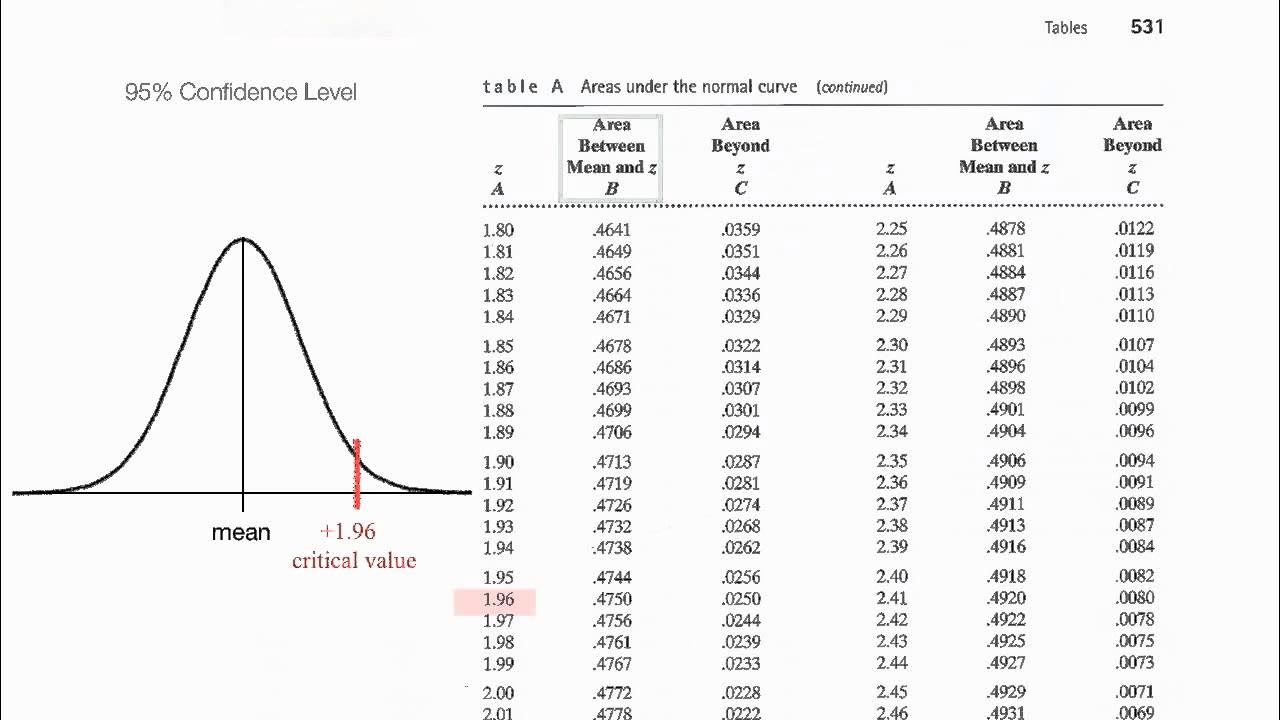
How can one find a Z score for different confidence levels using the table?
-The table provides Z scores at the bottom, corresponding to different confidence levels such as 90%, 95%, and 99%.
What is the T score for a 98% confidence level with 10 degrees of freedom according to the transcript?
-For a 98% confidence level with 10 degrees of freedom, the T score is 2.821.
Outlines
📊 Understanding T-Values for Confidence Intervals
This paragraph introduces the use of a score table to find T values for confidence interval problems. It explains that viewers may not use the same table shown in the video but will learn how to use their own table to find T values. The provided table is available for download as a PDF file. The concept of 'degrees of freedom' (DF) is introduced as a critical factor derived from the sample size, with an example calculation given. The paragraph walks through the process of locating the appropriate T value in the table based on the degrees of freedom and the desired confidence level, using two examples with confidence levels of 99% and 98%. It concludes with a reminder that the table also provides z-scores for different confidence levels, which can be referenced if needed.
Mindmap
Keywords
💡Score Table
💡Degrees of Freedom (DF)
💡Sample Size
💡Confidence Interval
💡T Value
💡Confidence Level
💡T-Test
💡Z-Score
💡Statistical Table
💡Hypothesis Testing
💡Null Hypothesis
Highlights
Introduction to using a score table to find T values for confidence intervals.
Emphasis on understanding how to use one's own T table after watching the video.
Explanation of the provided link to download a PDF T table.
Clarification of the term 'DF' and its meaning as degrees of freedom.
Instruction on calculating degrees of freedom from the sample size.
Guidance on locating the degrees of freedom in the T table.
Direction on finding the appropriate confidence level in the table.
Example given for a 99% confidence level and its corresponding T value.
Illustration of how to find the T value for a 98% confidence level.
Explanation of the process for using the T table for a t-test problem.
Demonstration of finding the T score for a specific confidence level.
Discussion on the importance of remembering the confidence levels on the table.
Information about the table providing z-scores for different confidence levels.
Mention of the three commonly discussed confidence levels: 90%, 95%, and 99%.
Advice on using the table to find z-scores if needed.
Closing with a reminder to refer to the table for specific numerical values.
Transcripts
Browse More Related Video
How To Find The Z Score Given The Confidence Level of a Normal Distribution 2
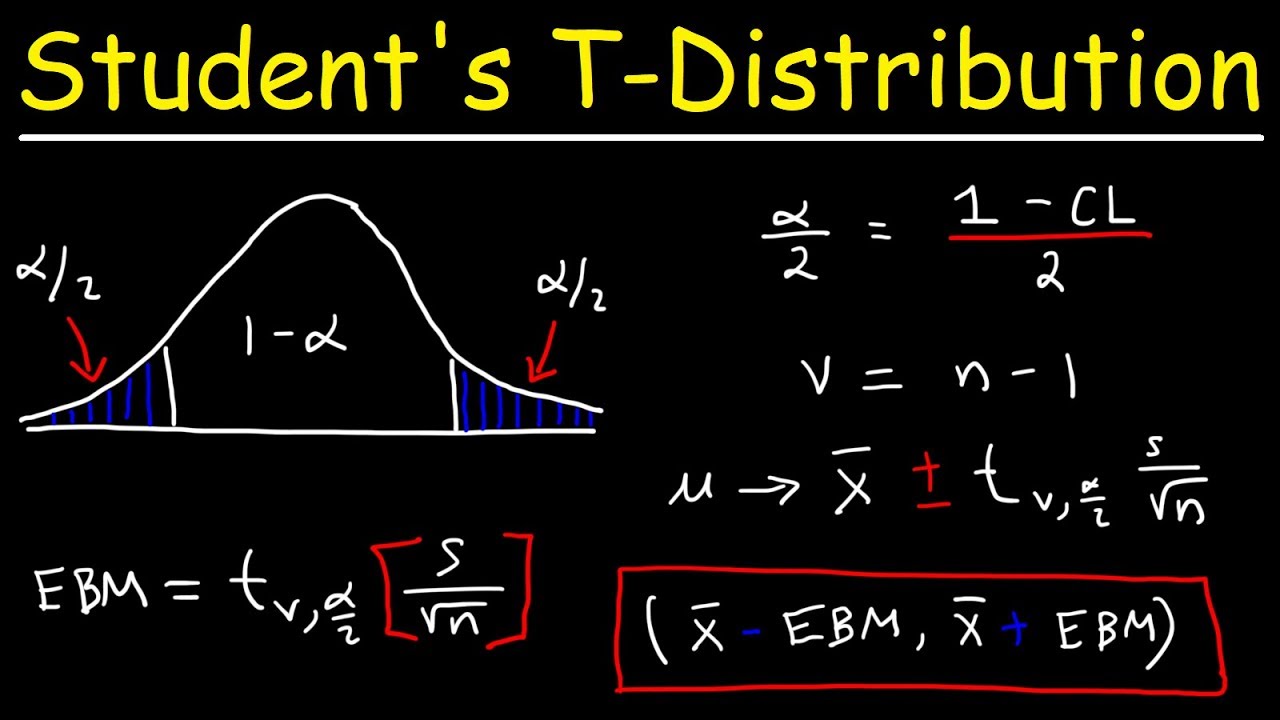
Student's T Distribution - Confidence Intervals & Margin of Error
Normalized Table: Understand z scores, p values, critical values

Elementary Statistics - Chapter 7 - Estimating Parameters and Determining Sample Sizes Part 2
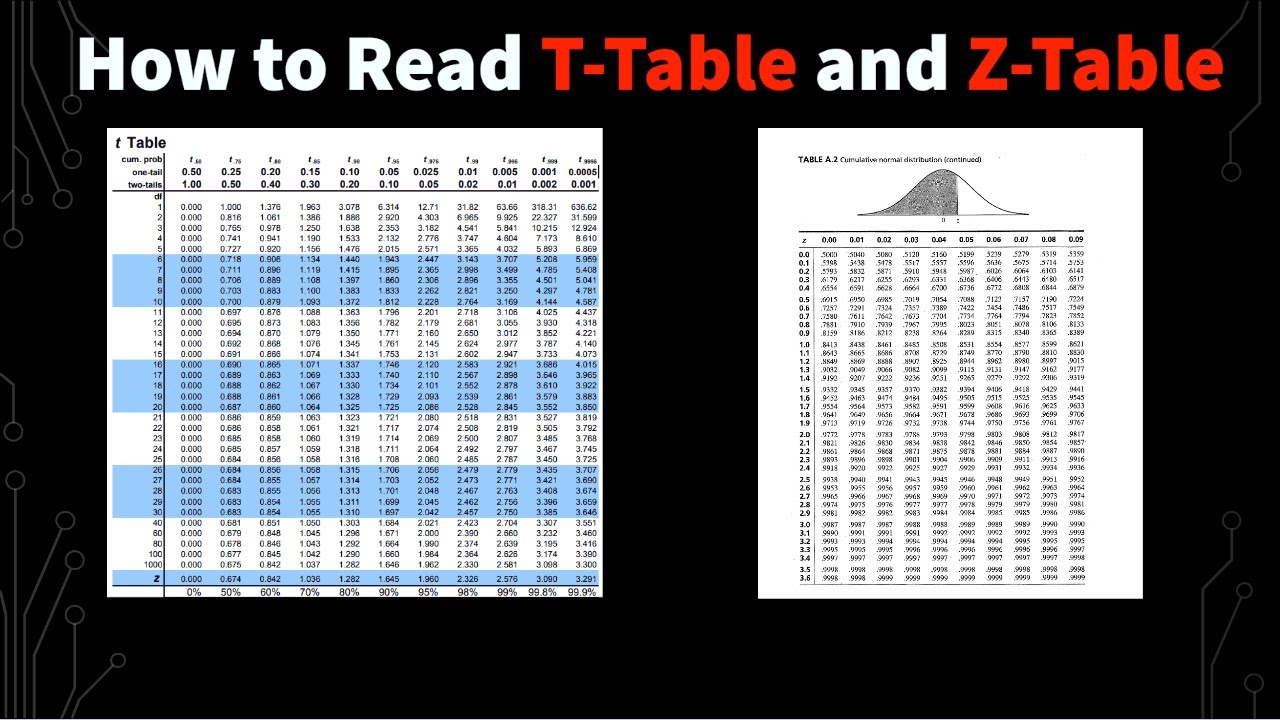
How to Read a T-Table and Z-Table
Confidence Interval for a population mean - t distribution
5.0 / 5 (0 votes)
Thanks for rating: