AP Statistics 2020 Review: Choosing Hypothesis Tests
TLDRThis educational video script offers a comprehensive guide on selecting the appropriate hypothesis test for statistical analysis. It distinguishes between tests for one sample mean or proportion and two samples, highlighting the importance of knowing the population standard deviation. The script explains when to use Z or T distributions, emphasizing the central limit theorem for large sample sizes. It also covers conditions for normality, independence, and randomness, crucial for valid statistical inference, and clarifies the use of Z tests for proportions due to the binomial distribution's properties.
Takeaways
- 📚 The video aims to educate viewers on selecting the appropriate hypothesis test based on the type of sampling and data involved.
- 🔍 Hypothesis tests are categorized into one sample mean, one proportion, two means, or two proportions.
- 🧐 The distinction between mean and proportion is crucial; a mean represents a numerical value, while a proportion is a percentage of a total, often related to categorical variables.
- 📈 For one sample mean tests, the choice between Z and T distribution depends on whether the population standard deviation is known and the sample size.
- 📊 The Z-test is used when the population standard deviation is known, while the T-test is for unknown population standard deviation with a relatively small sample size.
- 🤔 The central limit theorem supports the use of the Z-test for large sample sizes, as the sampling distribution will approximate a normal distribution.
- ✅ Conditions for hypothesis testing include normality, independence, and random sampling, with specific criteria for each test type.
- 🔄 For one proportion tests, a Z-test is always used because the standard deviation of the binomial distribution is known if the sample proportion is known.
- 🔗 The conditions for two sample tests involve normality of the sampling distributions, independence of the samples, and random sampling.
- 🔄 For matched pairs tests, the differences between the paired samples are treated as a single sample, simplifying the analysis to a one sample test.
- 📝 The script emphasizes the importance of understanding the normality condition, which varies among tests and is critical for the application of hypothesis tests.
Q & A
What are the key cornerstones in deciding which hypothesis test to use?
-The key cornerstones in deciding which hypothesis test to use are the type of sampling being conducted in the experiment, which can be categorized into one sample mean, one proportion, two means, or two proportions.
What is the difference between a proportion and a mean in statistical terms?
-A proportion is a binary categorical variable that represents a percentage out of a total, such as the percentage of people who wear seatbelts. A mean, on the other hand, is a numerical value that represents a quantity, such as the number of seeds in an apple, and is typically a quantitative variable.
When should you use a Z-test for a one sample mean?
-A Z-test for a one sample mean should be used when the population standard deviation is known or when the sample size is large enough (typically n ≥ 30) due to the central limit theorem, which states that the sampling distribution will be approximately normal.
What is the role of the central limit theorem in hypothesis testing?
-The central limit theorem plays a significant role in hypothesis testing as it states that the sampling distribution of the sample mean will be approximately normal if the sample size is large enough, regardless of the population distribution.
Why is the T-test preferred over the Z-test in certain scenarios?
-The T-test is preferred when the population standard deviation is unknown and the sample size is relatively small because it provides a more accurate estimation of the population mean in such cases.
What are the three conditions typically required for a hypothesis test involving one sample mean?
-The three conditions typically required are: 1) Normality, where the distribution should be approximately normal; 2) Independence, ensuring that the sample is drawn without replacement and is less than or equal to 10% of the population; and 3) Randomness, indicating that the sampling is done randomly without bias.
Why is the T-distribution used with degrees of freedom equal to n-1?
-The T-distribution is used with degrees of freedom equal to n-1 because it accounts for the loss of a degree of freedom when estimating the population standard deviation from the sample standard deviation.
What is the difference between a one-sample proportion test and a two-sample proportion test?
-A one-sample proportion test is used when analyzing a single proportion from a sample, while a two-sample proportion test is used to compare two proportions from two different samples or groups.
Why is the normal approximation to the binomial distribution important in hypothesis testing?
-The normal approximation to the binomial distribution is important because it allows for the use of Z-tests when dealing with proportions, as it assumes that the distribution of sample proportions will be approximately normal under certain conditions (e.g., n*p ≥ 10 and n*(1-p) ≥ 10).
What conditions must be met for a two-sample test involving proportions?
-For a two-sample test involving proportions, the conditions include: 1) Normality, where each sample's binomial distribution should be approximately normal; 2) Independence, ensuring that the samples are from separate groups with no connection; and 3) Randomness, indicating that each sample is randomly selected.
Outlines
📚 Introduction to Hypothesis Testing
The video script begins with an introduction to hypothesis testing, focusing on how to determine which test to use. The speaker addresses the urgency of this knowledge for upcoming exams and outlines the structure of the video. The main theme revolves around the decision-making process for selecting the appropriate hypothesis test based on the type of sampling involved: one sample, two samples, one proportion, or two proportions. The script also clarifies the difference between 'mean' and 'proportion,' explaining that a mean represents a numerical value, whereas a proportion is a percentage related to a total, such as the percentage of people who perform a certain action.
🔍 Deciding Between Z and T Tests for One Sample Mean
This paragraph delves into the specifics of choosing between Z and T tests for a one sample mean hypothesis test. The speaker explains that the Z test is used when the population standard deviation is known, which is less common, while the T test is the default choice due to its applicability when the population standard deviation is unknown and the sample size is small. The central limit theorem is mentioned as a justification for using the normal distribution when the sample size is large enough. The paragraph also discusses the conditions for using these tests, emphasizing the importance of normality, independence, and random sampling.
📉 Conditions for One Sample Mean Hypothesis Tests
The speaker continues the discussion by outlining the conditions necessary for conducting one sample mean hypothesis tests. For the Z test, the conditions include a normally distributed population or a large enough sample size to invoke the central limit theorem, independence in sampling, and random sampling without bias. For the T test, the conditions are similar, with the addition that the sample size must be small, and the test assumes normality due to the sample size rather than population knowledge. The script also addresses the degrees of freedom associated with the T test, which is n-1.
📈 Hypothesis Testing for One Proportion
The script shifts focus to hypothesis testing for a single proportion, explaining that this scenario always uses a Z test due to the nature of proportions and binomial distributions. The speaker clarifies that when the sample proportion is known, the population standard deviation can be inferred, making the Z test appropriate. The conditions for this test include the normal approximation of the binomial distribution, which requires a sufficient number of successes and failures (n * P and n * (1-P) both greater than or equal to 10), independence in sampling, and random sampling from a large enough population.
🤝 Two Sample Means and Proportions Hypothesis Tests
The final paragraph discusses hypothesis testing for two means and two proportions. The speaker differentiates between independent and dependent samples, providing examples for clarity. For dependent samples, a matched pairs test is suggested, which effectively turns the problem into a one sample test by examining the differences between paired observations. For independent samples, a two sample T test is common, with conditions similar to the one sample tests, including normality, independence, and randomness. The script also touches on the conditions for two proportion Z tests, emphasizing the need for a normal approximation to the binomial distribution for each sample and random sampling from independent populations.
Mindmap
Keywords
💡Hypothesis Test
💡Population Standard Deviation
💡Sample Standard Deviation
💡Central Limit Theorem
💡One Sample Mean
💡Proportion
💡Binomial Distribution
💡Independence
💡Random Sampling
💡Two Sample Test
💡Matched Pairs Test
Highlights
Video aims to help viewers decide which hypothesis test to use, a key cornerstone in statistics.
Categorizes hypothesis tests into four types based on sampling: one sample mean, one proportion, two means, and two proportions.
Explains the difference between a proportion (categorical variable) and a mean (quantitative variable).
Clarifies that the mean represents a numerical value, not necessarily a percentage, unlike a proportion.
Differentiates between sample statistics for means (x-bar, mu) and proportions (P hat, P).
Describes the decision process between using Z or T distribution for one sample mean tests.
Z test is used when the population standard deviation is known; T test is used when it's unknown and sample size is small.
Central Limit Theorem allows the use of Z distribution when sample size is large, regardless of the population standard deviation.
Outlines the three conditions for one sample mean tests: normality, independence, and randomness.
Discusses the specific conditions for using a Z distribution for one sample mean, including large sample size.
Explains the conditions for using a T distribution for one sample mean, focusing on small sample sizes and unknown population standard deviation.
Details the conditions for one sample proportion tests, emphasizing the use of Z distribution due to known population standard deviation.
Describes the normal approximation to the binomial distribution as a condition for proportion tests.
Covers the conditions for two sample mean tests, including the distinction between independent and dependent samples.
Explains the use of matched pairs test for dependent samples and the process of measuring differences.
Discusses the conditions for two independent sample tests, including the need for normality and random sampling.
Clarifies the conditions for two proportion tests, including the binomial approximation to the normal distribution for each sample.
Summarizes the importance of understanding the normality condition across different tests in statistics.
Concludes by emphasizing the importance of knowing when to use Z or T tests and understanding the underlying conditions.
Transcripts
Browse More Related Video
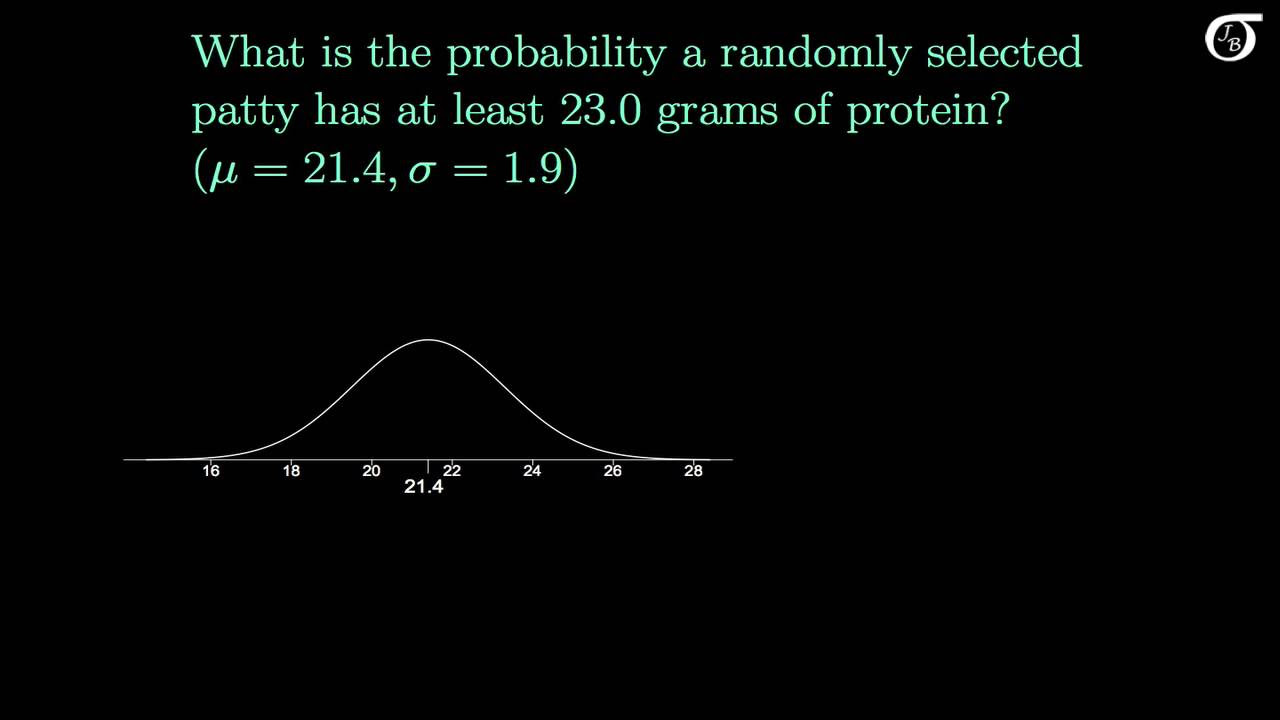
The Sampling Distribution of the Sample Mean
Z-statistics vs. T-statistics | Inferential statistics | Probability and Statistics | Khan Academy

t-Test - Full Course - Everything you need to know

Elementary Statistics - Chapter 7 - Estimating Parameters and Determining Sample Sizes Part 2

Elementary Statistics - Chapter 9 - Inferences from Two Samples
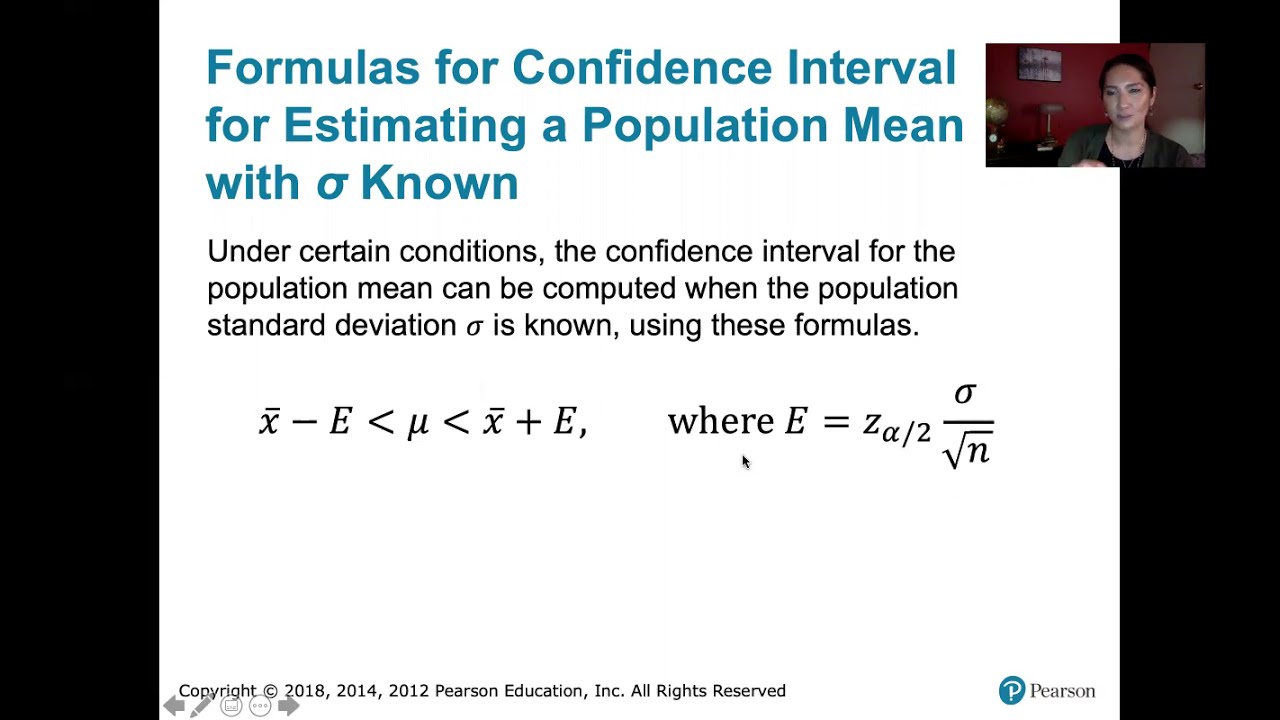
7.2.5 Estimating a Population Mean - Confidence Intervals with Known Pop. Standard Deviation
5.0 / 5 (0 votes)
Thanks for rating: