AP Psychology Statistics Simplified: Normal Distribution, Standard Deviation, Percentiles, Z-Scores
TLDRThis video script covers essential statistics concepts for AP Psychology students, including frequency distribution, normal and skewed distributions, mean, median, mode, standard deviation, z-scores, and percentiles. It uses relatable examples like basketball foul shots to explain these concepts and emphasizes the importance of understanding data analysis in psychology research.
Takeaways
- 📊 Statistics are crucial in AP Psychology as they help analyze data collected from psychological studies.
- 📈 A frequency distribution is a way to plot and analyze how often certain values or phenomena occur in a dataset.
- 🏀 An example given is of a PE teacher assessing basketball foul shots to demonstrate how data can be collected and plotted.
- 📚 The mean, median, and mode are key statistical measures, with the mean being the average, median the middle value, and mode the most frequent value.
- 🔍 A normal distribution, or bell curve, is characterized by data clustering around the mean with values tapering off equally on both sides.
- 📉 Skewed distributions occur when outliers significantly affect the data, causing the mean to shift and resulting in either a negatively or positively skewed graph.
- ⚠️ In skewed distributions, the median is a more reliable measure of central tendency than the mean due to the influence of outliers.
- 📐 Standard deviation is a measure of the spread of data values around the mean, indicating how close the values are to the average.
- 📊 The range of a dataset can be used as a shortcut to determine the standard deviation, with a larger range indicating a greater spread of data and thus a higher standard deviation.
- 📝 Z-scores represent the distance of a data point from the mean in terms of standard deviation units, allowing for comparison of scores relative to the average.
- 🔢 Percentiles indicate the percentage of scores below a particular score, providing a way to understand an individual's performance relative to a group.
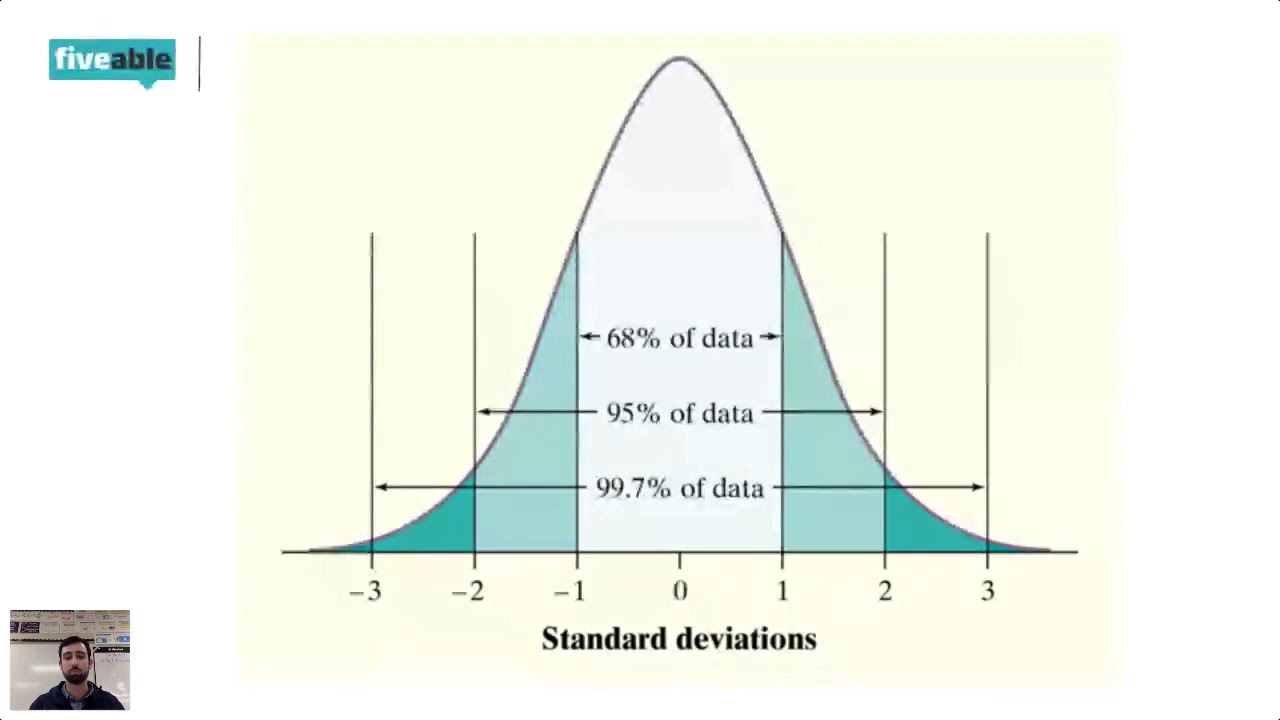
- 📚 Memorization of certain statistical concepts, such as the percentages of data within one, two, or three standard deviations from the mean, is important for AP Psychology.
Q & A
Why is it important for AP Psychology students to understand statistics?
-It's important because psychology researchers collect data through studies that need to be plotted and analyzed, and the College Board expects AP Psychology students to be able to interpret this data.
What is a frequency distribution?
-A frequency distribution is a way of plotting how often certain phenomena or values occur within a dataset.
What does a normal distribution represent in terms of data arrangement?
-A normal distribution represents an arrangement of data values that cluster around the mean, with values tapering off equally on both sides, forming a bell-shaped curve.
What are the three measures of central tendency, and how do they relate to each other in a normal distribution?
-The three measures of central tendency are mean, median, and mode. In a normal distribution, they all align around the center, with the mean being the average, the median the middle number, and the mode the most frequently occurring value.
What is a skewed distribution, and how does it differ from a normal distribution?
-A skewed distribution occurs when the data is not symmetrical and is pulled towards one end due to outliers. This differs from a normal distribution, where the data is symmetrically distributed around the mean.
Why is the median a more reliable measure of central tendency in a skewed distribution?
-The median is more reliable in a skewed distribution because the mean can be dramatically affected by outliers, while the median represents the middle value and is less influenced by extreme data points.
What is standard deviation, and how does it relate to the spread of data values?
-Standard deviation is a measure of spread that indicates how close the values in a dataset are to the mean. A smaller standard deviation means the values are closer to the mean, while a larger standard deviation indicates a greater spread of values.
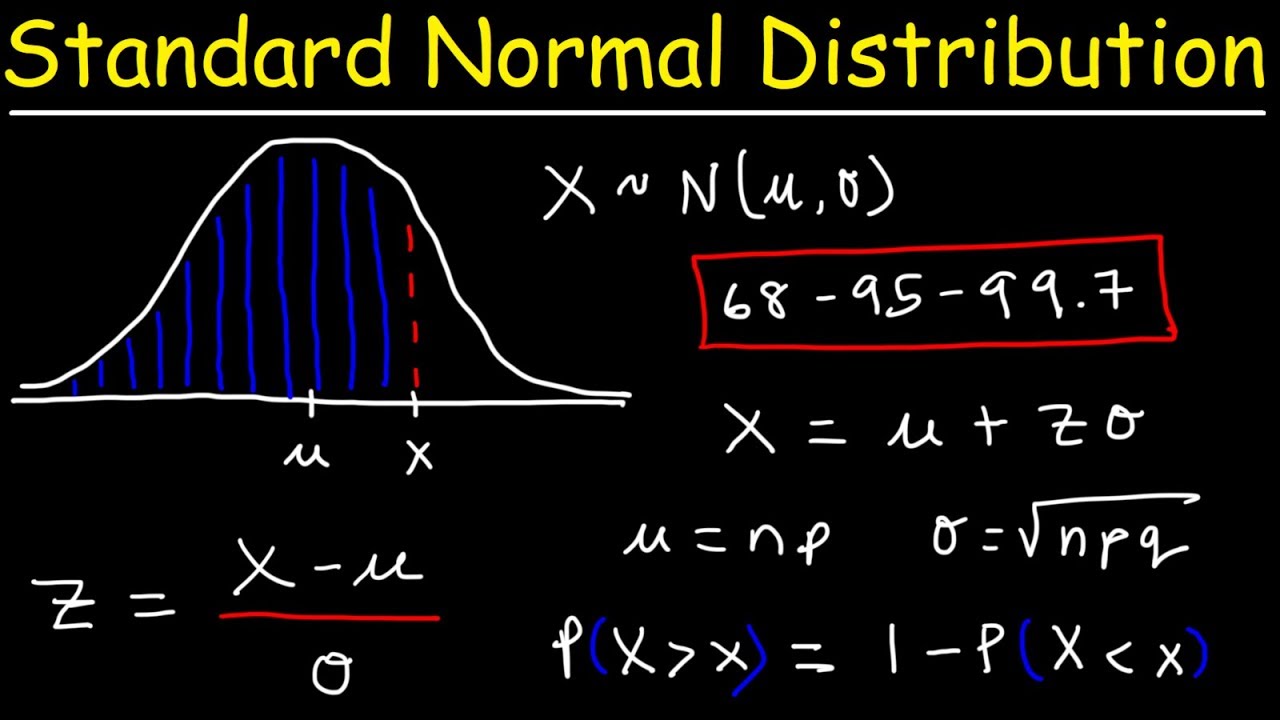
What is a z-score, and how is it used to measure the distance of a score from the mean?
-A z-score measures the distance of a score from the mean in units of standard deviation. It helps to identify how many standard deviations a particular score is from the average.
What is the significance of the 68-95-99.7 rule in terms of standard deviation?
-The 68-95-99.7 rule states that approximately 68% of data values fall within one standard deviation of the mean, 95% within two standard deviations, and 99.7% within three standard deviations in a normal distribution.
What are percentiles, and how do they relate to z-scores?
-Percentiles indicate the percentage of scores that fall below a particular score. They relate to z-scores by providing a way to understand the position of a score relative to the entire dataset, with specific percentiles corresponding to specific z-scores.
How can you determine the test score that corresponds to a given percentile?
-You can determine the test score for a given percentile by understanding the corresponding z-score and then using the mean and standard deviation to calculate the actual score.
Outlines
📊 Introduction to Statistics in AP Psychology
This paragraph introduces the importance of statistics in AP Psychology, emphasizing the need for students to understand how psychology researchers collect and analyze data. It begins with an example of a PE teacher assessing basketball foul shots to illustrate frequency distribution and the plotting of data. The concept of a normal distribution, characterized by a bell-shaped curve where the mean, median, and mode align, is explained. The paragraph also covers skewed distributions, which occur when outliers affect the data, causing the mean to shift and resulting in either a negatively or positively skewed graph. The importance of using the median as a measure of central tendency in skewed distributions is highlighted, as the mean can be significantly impacted by outliers.
📈 Understanding Distributions, Skewness, and Z-Scores
The second paragraph delves deeper into data analysis, discussing the impact of outliers on the shape of distribution curves and the distinction between normal and skewed distributions. It explains how to identify negatively and positively skewed graphs and the significance of the median in skewed distributions. The paragraph introduces the concept of standard deviation as a measure of spread, showing how it can be visually represented and used to compare the dispersion of different data sets. A shortcut for estimating standard deviation by examining the range of data is provided, along with an explanation of z-scores as a method to measure the distance of a score from the mean in terms of standard deviation units. Practical examples of applying z-scores to hypothetical test scores are given to illustrate their usage in AP Psychology.
📉 Standard Deviation, Percentiles, and Their Applications
The final paragraph focuses on the concept of standard deviation, explaining the empirical rule that describes the percentage of data values within certain z-scores in a normal distribution. It mentions the memorization of specific percentages associated with standard deviations, which is necessary for AP Psychology exams. The paragraph then transitions to discussing percentiles, which indicate the relative standing of a score within a data set. Examples of how percentiles are used in real-life situations, such as measuring head size or test performance, are provided. The relationship between z-scores and percentiles is explored, with a guide on how to convert between the two for test questions. The video concludes with a brief overview of the importance of understanding these statistical concepts for AP Psychology students.
Mindmap
Keywords
💡Frequency Distribution
💡Normal Distribution
💡Mean
💡Median
💡Mode
💡Skewed Distribution
💡Standard Deviation
💡Z-score
💡Percentile
💡Range
Highlights
Statistics are essential in AP Psychology for analyzing data collected by researchers.
Frequency distribution is introduced as plotting the occurrence of certain phenomena.
An example of plotting basketball foul shots to demonstrate data collection and analysis.
The concept of a normal distribution and its characteristics, including mean, median, and mode alignment.
The bell curve is explained as a visual representation of a normal distribution.
Skewed distributions are discussed, including negatively skewed graphs due to outliers.
The impact of outliers on the mean and the preference for using the median in skewed distributions.
Positively skewed graphs are explained with examples of high-performing and low-performing students.
Standard deviation is introduced as a measure of data spread relative to the mean.
A shortcut for estimating standard deviation by examining the range of data sets.
Z-scores are explained as a method to measure the distance of scores from the mean in standard deviation units.
How to plot and interpret z-scores on a normal distribution graph.
Percentiles are introduced to indicate the percentage of scores below a particular score.
Examples of how percentiles are used in real-life scenarios, such as test results.
The relationship between z-scores and percentiles and how to convert between them.
Memorization of specific z-score to percentile mappings for AP Psychology.
The practical application of statistics in understanding test scores and percentiles.
A summary of the importance of statistics in AP Psychology and its real-world relevance.
Transcripts
Browse More Related Video
AP Stats - Cram Review (2019)

Elementary Statistics - Chapter 6 Normal Probability Distributions Part 1

Introduction to Descriptive Statistics

Statistics Lecture 3.2: Finding the Center of a Data Set. Mean, Median, Mode
Standard Normal Distribution Tables, Z Scores, Probability & Empirical Rule - Stats
What is Descriptive Statistics ... [Examples and Concept - Mean Median Mode]
5.0 / 5 (0 votes)
Thanks for rating: